Originally a guest post 20 December 2019 at Climate Etc
In an earlier article here I discussed a Comment on Lewis and Curry 2018 (LC18) by Kevin Cowtan and Peter Jacobs (CJ20), and a Reply from myself and Judith Curry recently published by Journal of Climate (copy available here). I wrote that I would defer dealing with the differences between observed and CMIP5 model-simulated historical warming, which formed the basis of CJ20’s numerical analysis, until a subsequent article. I now do so.
Differences between observed and CMIP5 model-simulated historical warming
CJ20 compared mean warming in CMIP5 model historical simulations with observed warming between varying early and late windows. They found that “Different window choices can lead to the conclusion that the model results show significantly faster warming than the observations do or that the observations warm slightly faster than the model results”. However, such a comparison is meaningless unless the evolution of forcing is the same in the model simulations as it is estimated to be in reality. We show in the Reply that this is not the case: forcing increases more slowly in the CMIP5 model mean than as estimated in LC18, based on IPCC AR5 best-estimate time series, updated to 2016 and revised where appropriate. To provide a better comparison, we remove the temperature changes caused by volcanic forcing (to which the climate system responds differently from other forcings), which are much larger in CMIP5 models than in observations – and compare total forcing with the volcanic component removed.
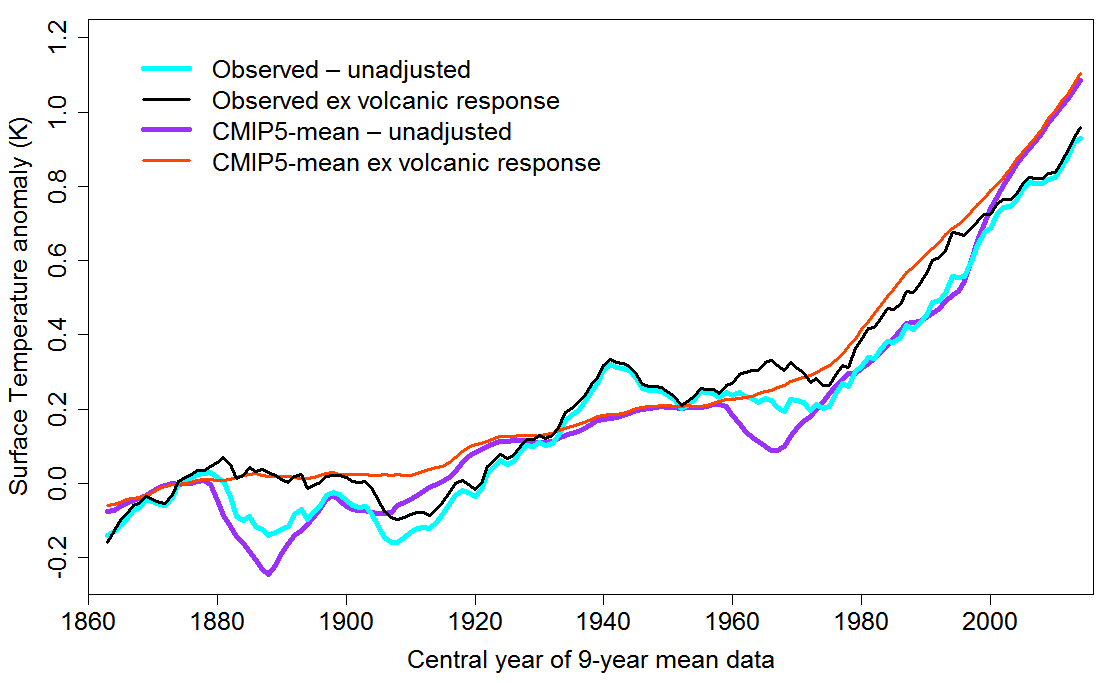
Figure 1 in the Reply, reproduced below, shows how observed and CMIP5 simulated historical global temperature evolution compares, before and after removal of volcanic influences.

Figure 1. CMIP5-mean and observed global mean warming before and after removing the response to volcanism: centered 9-year running means of anomalies relative to the 1869–82 mean. CMIP5 historical simulations have been extended using RCP4.5 simulation data. The averaging period is reduced at either end, to a minimum of 5 years.
The faster initial rise in observed than simulated temperature is likely due to the omission of mean volcanic forcing from most CMIP5 preindustrial control simulations. That omission reduces CMIP5-mean warming over the historical period by 0.1°C, mainly during the third quarter of the 19th century. But even from the adopted baseline of 1869-1882, the primary LC18 early window, CMIP5-mean warming eventually climbs clear of observed warming. What we said in the Reply was:
On decadal timescales, the mean evolution of warming of CMIP5 models over the historical period broadly matches that of observed warming until 2000, with some fluctuation (Figure 1, thick purple and cyan lines). When the fitted response to volcanic forcing is removed (Figure 1, black and orange-red lines), CMIP5-mean historical/RCP4.5 warming exceeds observed warming by the mid-1980s, with the gap widening from the mid-1990s.
The post-1900 cooling, and the lack of warming between the 1940s and the 1970s, in observed surface temperature with the response to volcanism removed, likely reflects cool phases of the Atlantic Multidecadal Oscillation (AMO).
Since the transient climate response (TCR) of CMIP5 models is 35% or so higher than the observationally-based best estimate in LC18, one might expect CMIP5-mean warming to exceed observed warming before then. The main reason it doesn’t is that historical forcing evolves more slowly in CMIP5 models than per the LC18 revised and updated AR5-based forcing time series. This is mainly, but not entirely, due to CMIP5-mean aerosol forcing, growing increasingly more negative than per LC18 up to the 1970s, since when it is has not changed greatly.
Forcing evolution in CMIP5 historical simulations can only be derived approximately, since unfortunately it was not generally diagnosed. However, we show in the Supporting Information for the Reply that, for two models where evolving historical simulation forcing was diagnosed, it can be accurately derived as:
ΔF = ΔN + λ × ΔT
where Δ signifies a change or anomaly from a reference period mean, F is effective radiative forcing (ERF), N is global top-of-atmosphere radiative imbalance, T is global surface temperature and λ is climate feedback estimated by regression of N against T over the first 50 years after an abrupt step increase in CO2 concentration. See also my article here. This method was used in Forster et al. 2013, but with λ estimated over the full 150 years of abrupt4xCO2 simulations, a period with a much longer average age of forcing than the historical period and which generally gives lower climate feedback estimates for CMIP5 models. While use of this method involves partial circularity when going on to compare warming ratios and forcing ratios between models and observations, it appears to be quite accurate, and superior to cruder methods such as that used in Gregory et al 2019
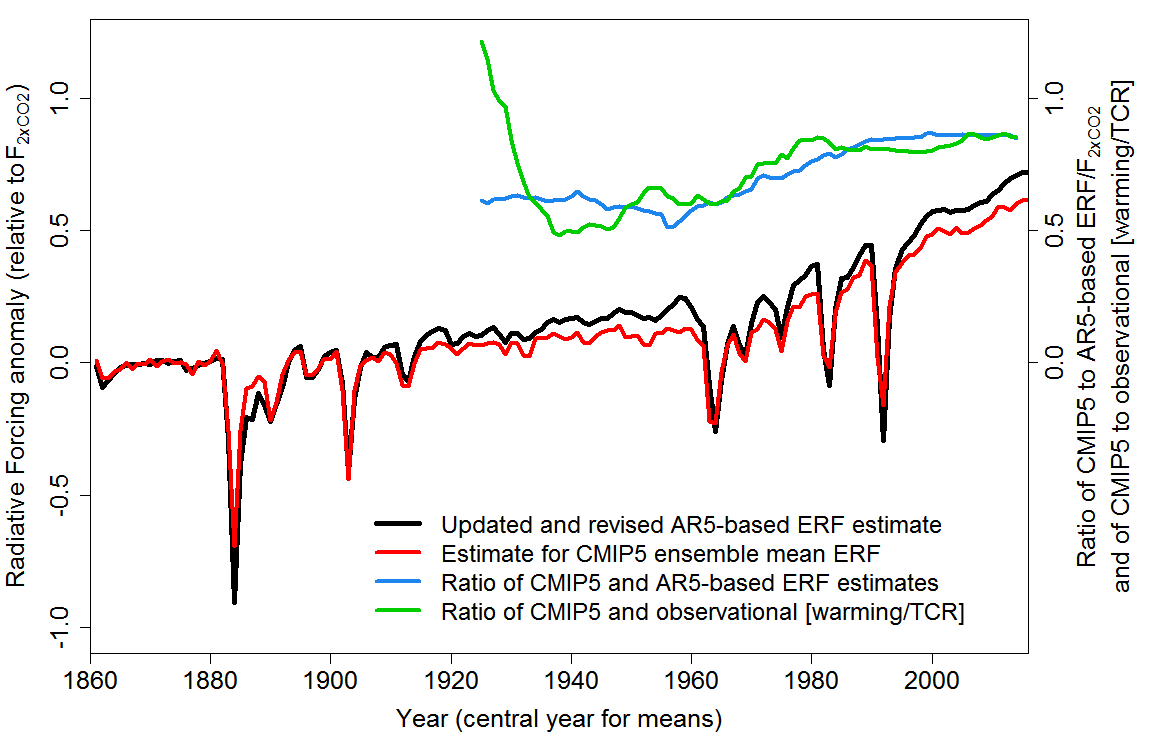
Figure 2 in the Reply, reproduced below, shows the estimated forcing evolution in CMIP5 historical simulations (red line) compared to the AR5-based/LC18 median estimate (black line), and how their ex-volcanic ratio (blue line) compares with the corresponding ratio of ex-volcanic warming relative to TCR (green line).
Figure 2. CMIP5-mean and AR5-based/LC18 ex-volcanic ERF relative to F2xCO2 (the ERF for a doubling of atmospheric CO2 concentration) over 1861–2016, their ratio and the corresponding ratio of CMIP5-mean and observational warming relative to respectively CMIP5-mean and observational TCR estimates, of 1.82 K and 1.33 K respectively. Based on an ensemble of 25 CMIP5 models with the requisite data and the LC18 preferred median TCR estimate when using globally-complete Had4_krig_v2 temperature data. Values are anomalies from the 1869–82 mean. Relative ERF and relative warming ratios are calculated model-by-model before computing CMIP5 means. Ratios are of centered 15-year running means (shortened to 5 years by the final year plotted, 2014).
This is what we say about Figure 2 in the Reply:
When the green line is above the blue line, CMIP5-mean warming relative to that observed is greater than predicted by their respective TCR and [ex-volcanic ERF] estimates, and vice versa. The relative warming ratio starts off much higher than the relative forcing ratio, reflecting the unusually cold first quarter of the 20th century, before falling below the relative forcing ratio during the warm period centered around 1940, when the AMO was positive. From the late 1950s until circa 1990, the relative warming ratio largely tracks the rising relative forcing ratio, but generally exceeds it as the negative phase of the AMO, which reached its nadir in the 1970s, was associated with cooler global temperature. After 1990 the relative warming ratio remains close to the relative forcing ratio, as is to be expected if the LC18 TCR estimate is accurate.
From the late 1990s on, the ratio of estimated ERF in CMIP5 models to the updated and revised AR5-based ERF used in LC18 has been stable at around 0.85. That is very close to the 0.86 ratio in Otto et al. 2013 of estimated CMIP5-mean ERF in 2010 before and after adjusting for CMIP5 models’ stronger than AR5-based aerosol ERF.
Conclusions
The conclusion we drew in the Reply from this analysis sums up the results of our analysis:
The differing evolution of temperature in observations versus models is consistent with the substantially different observationally-based and CMIP5-mean TCR estimates once differences in the evolution of estimated forcing and in the effects of volcanism and multidecadal internal variability are accounted for.
Nicholas Lewis 20 December 2019

Leave A Comment