Originally posted on Mar 19, 2014 at Bishop Hill
As many readers will know, there is a lengthy and pretty civilised discussion of the recent Lewis/Crok report ‘A Sensitive Matter’ on Ed Hawkins’ blog Climate Lab Book, here. In that report, we gave a ‘likely’ (17-83% probability) range for the transient climate response (TCR) of 1.0°C to 2.0°C. TCR is more relevant to warming over the rest of this century than equilibrium climate sensitivity (ECS).
The guest post by Piers Forster that headed the Climate Lab Book thread made the mistaken claim:
Particularly relevant, is our analysis in Forster et al. (2013) that confirms that the Gregory and Forster (2008) method employed in the Lewis & Crok report to make projections (by scaling TCR) leads to systematic underestimates of future temperature change (see Figure 1), especially for low emissions scenarios, as was already noted by Gregory and Forster (2008).
However, that wasn’t really Piers’ fault as he had, I believe, probably gained an incorrect understanding as to the method used in our report from another climate scientist. After I pointed this out, Piers very properly backtracked later in the thread, writing:
Nic’s pipeline factor may correct the underestimate, or it may not. I don’t think we have any way of knowing. To me this gets to the nub of my point on assumptions. I’m not really trying to say Nic’s results are wrong. I’m just trying to show that model and assumption choices have a huge effect as there is no perfect “correct” analysis method.
I agree that there is no perfect ‘correct’ analysis method for TCR and ECS. But there are plenty of studies using methods and/or data that are clearly incorrect, and whose results should therefore be discounted, as the authors of the IPCC AR5 report did for some methods and we did in the report in relation to certain studies. Some people have accused us of cherry picking – or as AR5 WGI co-chair Thomas Stocker put it in the newspaper Die Weltwoche, according to Google Translate:
He criticized the authors have picked them agreeable studies as raisins.
However, in fact I had identified serious shortcomings in all the ECS and TCR studies used in AR5 that we discounted, as described here.
Returning to Ed Hawkins, in his comments at Climate Lab Book he wrote:
As Piers’ post points out, there is evidence that the approach adopted by Lewis & Crok is sensitive to decisions in the methodology and may underestimate TCR.
which perhaps puts a slant on Piers’ position.
That brings me to the main point of this post. Ed Hawkins has recently had a new study accepted by Journal of Climate (pay-walled). Congratulations, Ed. Being a scientist not a politician, I don’t believe in making knee-jerk reactions to lengthy, detailed work. So I won’t criticise Ed’s study until I have thoroughly read and digested it, and then only if I think it has serious shortcomings. However, I do have a few initial observations to make on it.
Ed’s new study uses a small ensemble of versions of the Met Office HadCM3 climate model with different parameter settings, and hence varying ECS and TCR values. Although the study is mostly about evaluating and correcting decadal climate hindcasts, it also deduces a probabilistic estimate for TCR. It isn’t yet clear to me whether the method is sound and the study’s conclusions about TCR justified. But even assuming they are, given all the uncertainties involved and the use of a single climate model it seems appropriate to take the more conservative, wider, of the 5-95% ranges for TCR that the study gives (doubling the identified assumed errors).
So how does the more conservative 5–95% range for TCR given in Ed’s study compare with the 17–83% range given in the Lewis/Crok report, which ‘may underestimate TCR’ according to him? Well, what do you know, his range is 0.9°C to 1.9°C – slightly lower than our 1.0°C to 2.0°C range. And much tighter, as his is a 5–95% range and ours only a 17–83% range.
So here’s another study supporting our contention that the top of the IPCC’s 17–83% range for TCR is much too high at 2.5°C. Indeed, almost half the CMIP5 models’ TCR values given in AR5 exceed the conservative range 95% bound of 1.9°C in Ed Hawkins’ new study – the newer Met Office HadGEM2-ES model being way above at 2.5°C.
Moreover, most of the CMIP5 models used for the AR5 projections of climate change show significantly higher warming over the rest of the century than one might expect from their TCR values: their ‘effective TCR’ from the 2000s to the 2090s exceeds their actual TCR. Figure 8 of our study, reproduced below, shows this – compare the magenta and salmon bars.
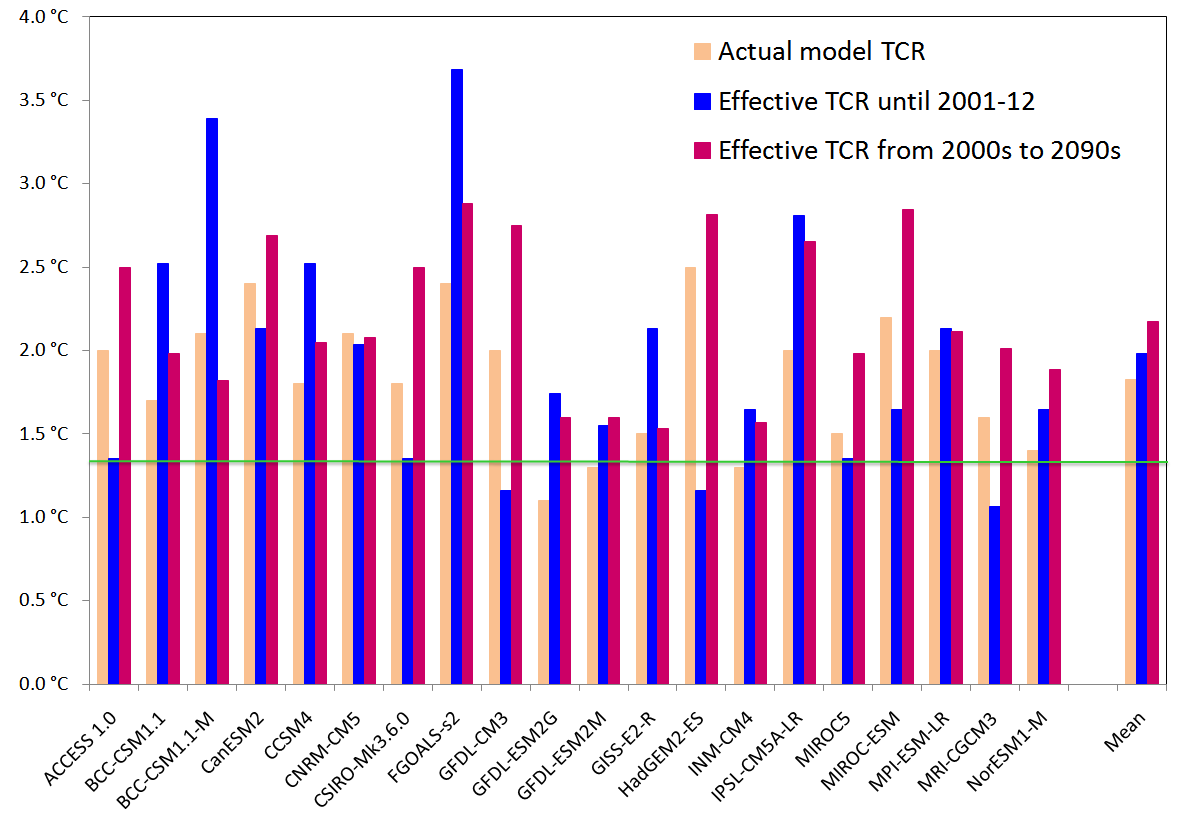
Effective TCRs for CMIP5 models analysed in Forster 2013
The salmon bars show model TCRs, estimated as per the definition of TCR, by increasing the CO2 concentration in the model by 1% p.a. for 70 years. The blue bars show TCR estimatesbased on model simulations over the instrumental period, to 2001–12, i.e. ‘effective historical’ model TCRs. The magenta bars show TCR estimates based on the subsequent change in model-simulated temperatures to 2091–99 on the RCP8.5 scenario, i.e. ‘effective future’ model TCRs. The multimodel means are shown at the right. The horizontal green line shows the observationally-based TCR best estimate of 1.35°C.
Nicholas Lewis
Leave A Comment