Originally posted on November 30, 2015 at Climate Etc.
The mean carbon cycle behaviour of CMIP5 ESMs and EMICs may be quite unrealistic.
IPCC AR5 states (WG1 SPM E.8) that “Cumulative total emissions of CO2 and global mean surface temperature [GMST] response are approximately linearly related”. The mean increase in GMST with cumulative CO2 emissions simulated by current CMIP5 Earth System Models (ESMs) and EMICs[1] was presented in AR5 (Figure SPM.10; coloured lines) for differing Representative Concentration Pathway scenarios (RCPs).
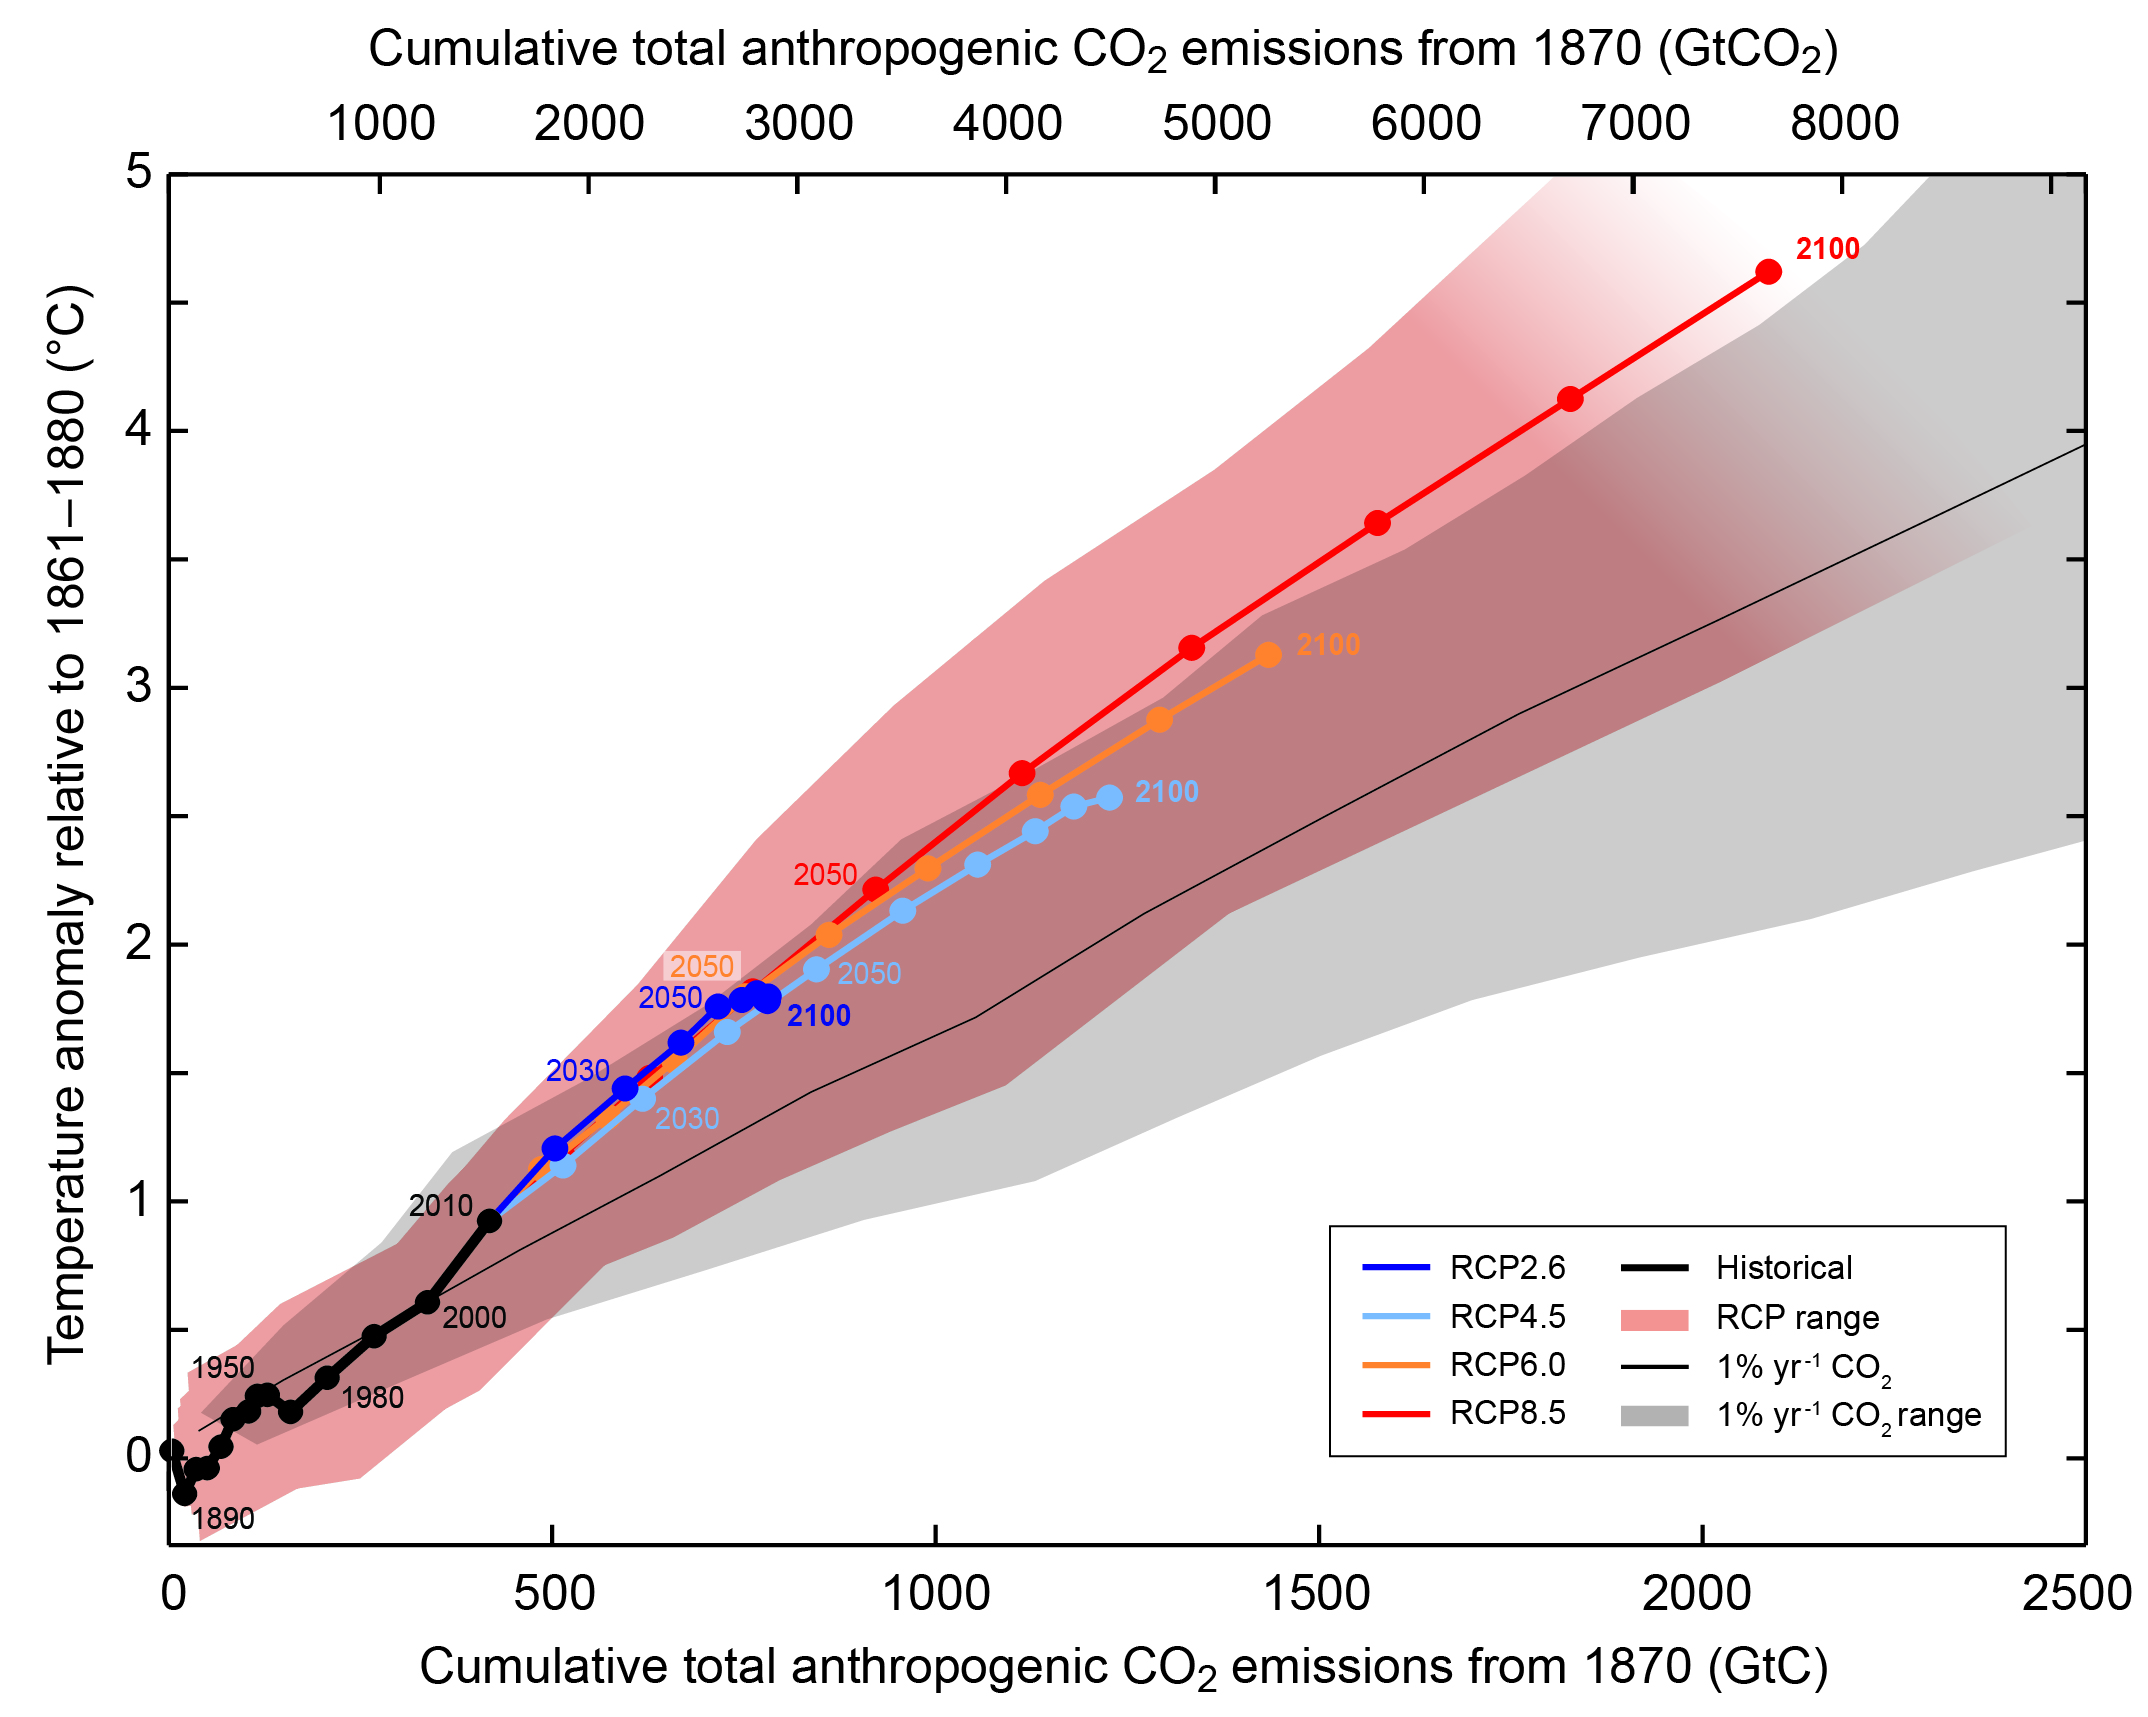
Figure SPM.10: Global mean surface temperature increase as a function of cumulative total global CO2 emissions from various lines of evidence. Multi-model results from a hierarchy of climate-carbon cycle models for each RCP until 2100 are shown with coloured lines and decadal means (dots). Some decadal means are indicated for clarity (e.g., 2050 indicating the decade 2041−2050). Model results over the historical period (1860–2010) are indicated in black. The coloured plume illustrates the multi-model spread over the four RCP scenarios and fades with the decreasing number of available models in RCP8.5. The multi-model mean and range simulated by CMIP5 models, forced by a CO2 increase of 1% per year (1% per year CO2 simulations), is given by the thin black line and grey area. For a specific amount of cumulative CO2 emissions, the 1% per year CO2 simulations exhibit lower warming than those driven by RCPs, which include additional non-CO2 drivers. All values are given relative to the 1861−1880 base period. Decadal averages are connected by straight lines
The relationship shown in Figure SPM.10 appears to be accepted at face value by most people involved in considering what emission reductions are required to limit the end-century rise in GMST to 2°C relative to preindustrial. The CMIP5 ESM mean sensitivity of GMST to cumulative CO2 emissions – the transient climate response to cumulative carbon emissions (TCRE) – is 2.4°C/TtC at a 2°C rise from 1870. That is for RCP8.5, but TCRE varies very little between the different RCPs.
But is the mean behaviour of CMIP5 ESMs realistic? AR5 had this to say: “Expert judgement based on the available evidence therefore suggests that the TCRE is likely between 0.8°C to 2.5°C per 1000 PgC,[2] for cumulative CO2 emissions less than about 2000 PgC until the time at which temperature peaks.” The 2.4°C/TtC CMIP5 mean is only just below the top of that range.
Observationally-based evidence is thin on the ground, but a recent multimodel attribution study[3] relied upon for the AR5 anthropogenic attribution findings, estimated TCRE by scaling CMIP5 model projections to obtain a best match to observed temperature changes. It estimated a 5–95% range for TCRE of 0.7–2.0°C/TtC, implying that the 2.4°C/TtC CMIP5 mean TCRE is too high, even allowing for its element of warming from non-CO2 forcing. Moreover, that attribution based estimate may be biased upwards, since most CMIP5 models appear to underestimate carbon uptake, particularly for land, and carbon uptake by land and ocean sinks was not constrained to match observations. Estimates of the land carbon sink have been revised up significantly in recent years. Moreover, recent observational estimates[4] of land carbon-climate feedback are lower than in most CMIP5 models.
Unfortunately, the response of biogeochemical systems to projected changes in atmospheric CO2 and climate is currently poorly understood. Inadequate scientific understanding of land and ocean carbon cycles is reflected in CMIP5 ESMs exhibiting great variation in carbon uptake in response to projected changes in atmospheric CO2 concentration and GMST, and hence substantial uncertainty in atmospheric CO2 concentration towards the end of the 21st century. Whilst a few CMIP5 ESMs underestimate the historical increase in atmospheric CO2, most CMIP5 models overestimate it, and their projections of future atmospheric CO2 levels are closely related to their existing bias.[5] The response of the land carbon cycle to anthropogenic CO2 emissions varies enormously between CMIP5 ESMs, with diagnosed carbon-concentration and carbon-climate feedback parameters each varying over the best part of an order of magnitude.[6] CMIP5 ESMs do not even agree on the sign of land carbon uptake over the RCP 2006–2100 projection period.[7] Moreover, it seems that all current models are missing an important process that significantly increases the CO2 fertilisation effect (Sun et al., 2014).[8] The existence of all these problems suggests that the mean carbon cycle behaviour of CMIP5 ESMs and EMICs may be quite unrealistic. Perhaps it would be better at this stage to use much simpler ESMs, with a few key parameters that can be selected so as to match observationally-based estimates of carbon-cycle and climate system behaviour.
With this objective, I have recently developed a simple but physically-consistent ESM, with 2-box climate and ocean carbon sink sub-models. Its ocean carbon-cycle sub-model respects ocean carbonate chemistry and AR5 estimates of surface and deep ocean carbon reservoirs and flows, and its land carbon sink sub-model’s characteristics are consistent with feedback parameter estimates in a recent paper.[9] I select the simple ESM’s key climate, and land and ocean carbon-cycle, sub-model parameters so that its simulated global temperature, heat uptake and carbon-cycle changes since preindustrial best match recent observational estimates, sourced largely from AR5. The CO2 emissions and non-CO2 forcings used to drive the simple ESM are primarily taken from the RCP dataset, but with values modified to conform with the more recent AR5 estimates over 1765-2011.[10] That results in the model having an equilibrium climate sensitivity (ECS) of 1.7°C and a transient climate response (TCR) of a little over 1.35°C.
The below figure – a revised version of one that I prepared for a recent climate science meeting – compares the relation of GMST to cumulative emissions as simulated by the observationally-constrained simple ESM (solid lines) with the mean for CMIP5 models per AR5 (dashed lines). The coloured lines show the relationship for each RCP; the black lines show simulation results up to 2000–09. Decadal mean values are plotted.
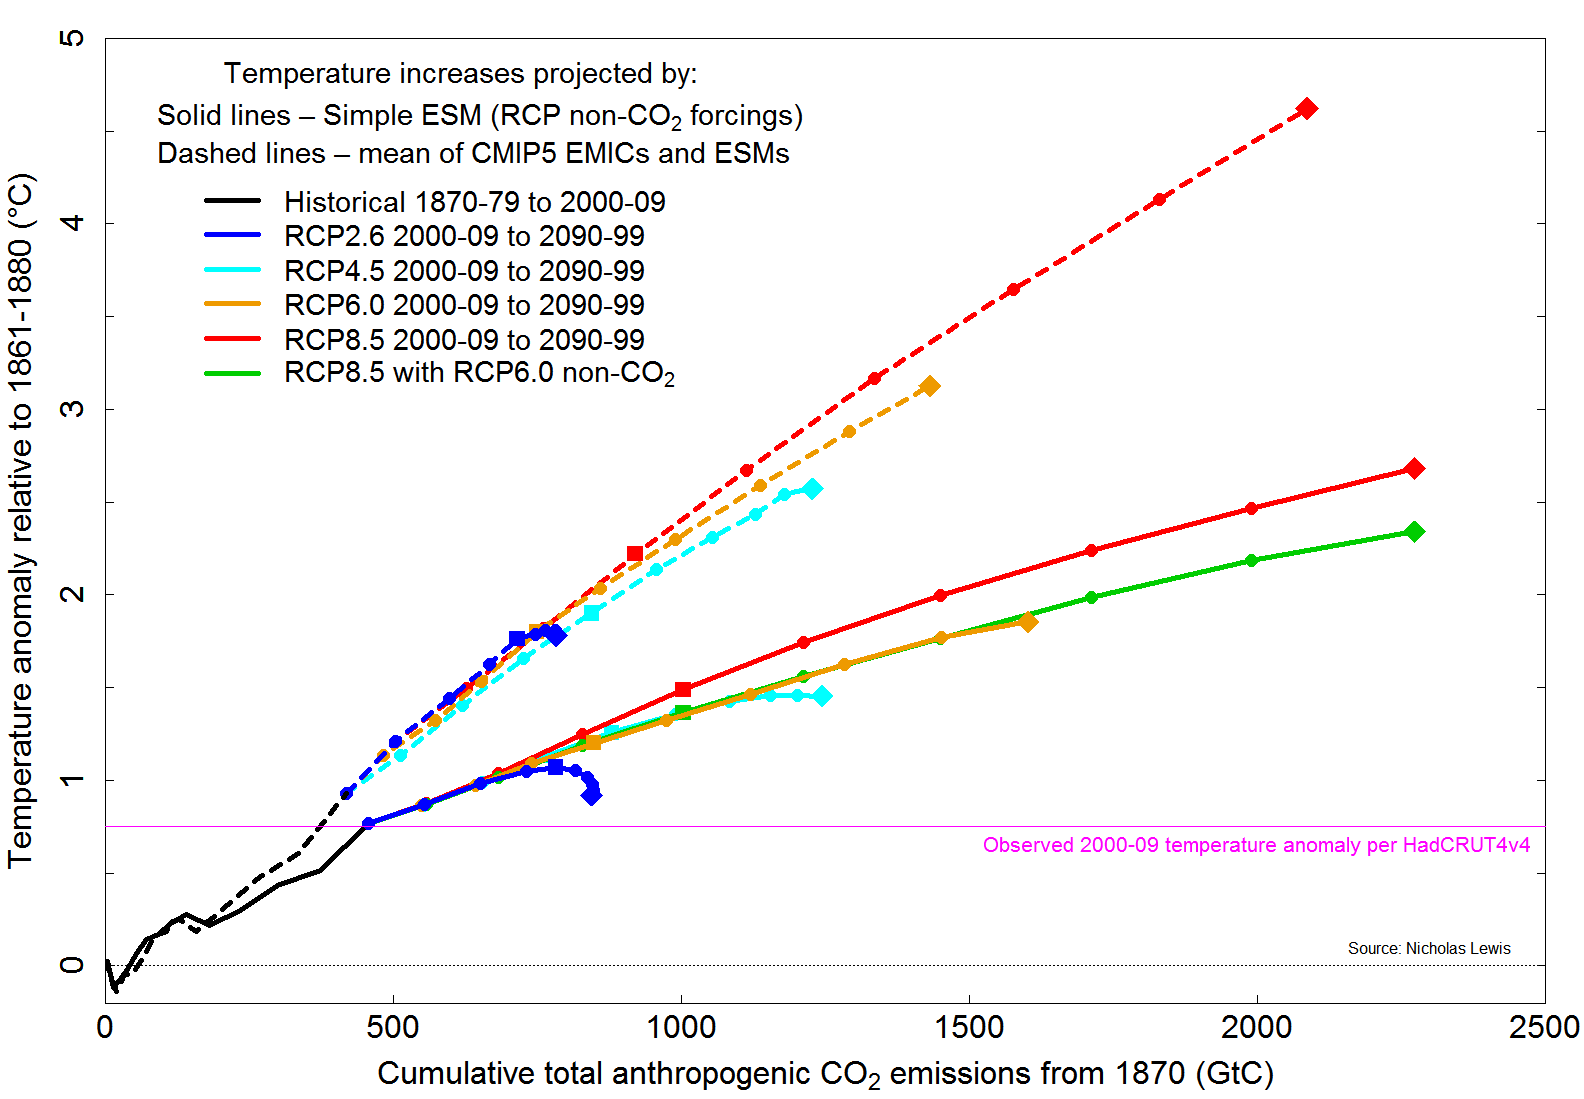
On all scenarios except RCP8.5, the simple ESM shows a TCRE of ~1.15°C/TtC, just under half that per the CMIP5 multimodel mean. On RCP8.5, the simple model TCRE is slightly higher, approaching 1.4°C/TtC. That TCRE is distorted by the much higher non-CO2 forcing per RCP8.5 compared with all other scenarios (principally due to very pessimistic assumptions in RCP8.5 about methane emissions). When non-CO2 forcings per RCP6.0 are substituted for those per RCP8.5 (resulting in the green line), the TCRE based on RCP8.5 CO2 emissions is the same, 1.15°C/TtC, as for other scenarios. A better estimate of the simple ESM’s pure TCRE, with forcing only from CO2, is ~0.9°C/TtC.
Nicholas Lewis
Note: Units of GtC in the version originally posted have been corrected to TtC [1 TtC= 1000 GtC]
End notes
[1] Earth models of intermediate complexity
[2] 1000 PgC = 1000 GtC
[3] Gillett, NP et al. (2013) Constraining the ratio of global warming to cumulative CO2 emissions using CMIP5 simulations. J. Clim., 26, 6844–6858
[4] e.g., Frank DC, Esper J, Raible CC, Büntgen U, Trouet V, Stocker B, Joos F. 2010 Ensemble reconstruction constraints on the global carbon cycle sensitivity to climate. Nature 463, 527–530.
[5] F M Hoffman et al, 2013. Causes and implications of persistent atmospheric carbon dioxide biases in Earth System Models. J. Geophys. Res. Biogeosci., 119, 141–162
[6] Arora, V K et al., 2013: Carbon–concentration and carbon–climate feedbacks in CMIP5 earth system models. J. Climate, 26, 5289–5314.
[7] Based on RCP data and RCP8.5 scenario projections. P. Friedlingstein et al., 2014. Uncertainties in CMIP5 Climate Projections due to Carbon Cycle Feedbacks. J Climate, 27, 511-526
[8] Sun, Y. et al.,2014. Sun_Impact of mesophyll diffusion on estimated global land CO2 fertilization. PNAS, 111, 15774-15779
[9] Friedlingstein, P (2015) Carbon cycle feedbacks and future climate change. Phil Trans R Soc A.373:20140421
[10] Except for volcanic forcing, where the lower RCP estimates are preferred.
Leave A Comment