Originally posted on Sep 5, 2013 at Bishop Hill
In response to yesterday’s post about Mark Walport’s slide on climate projections, Nic Lewis sends some thoughts about the underlying model – HadGEM2-ES – and its projections of warming to 2100.
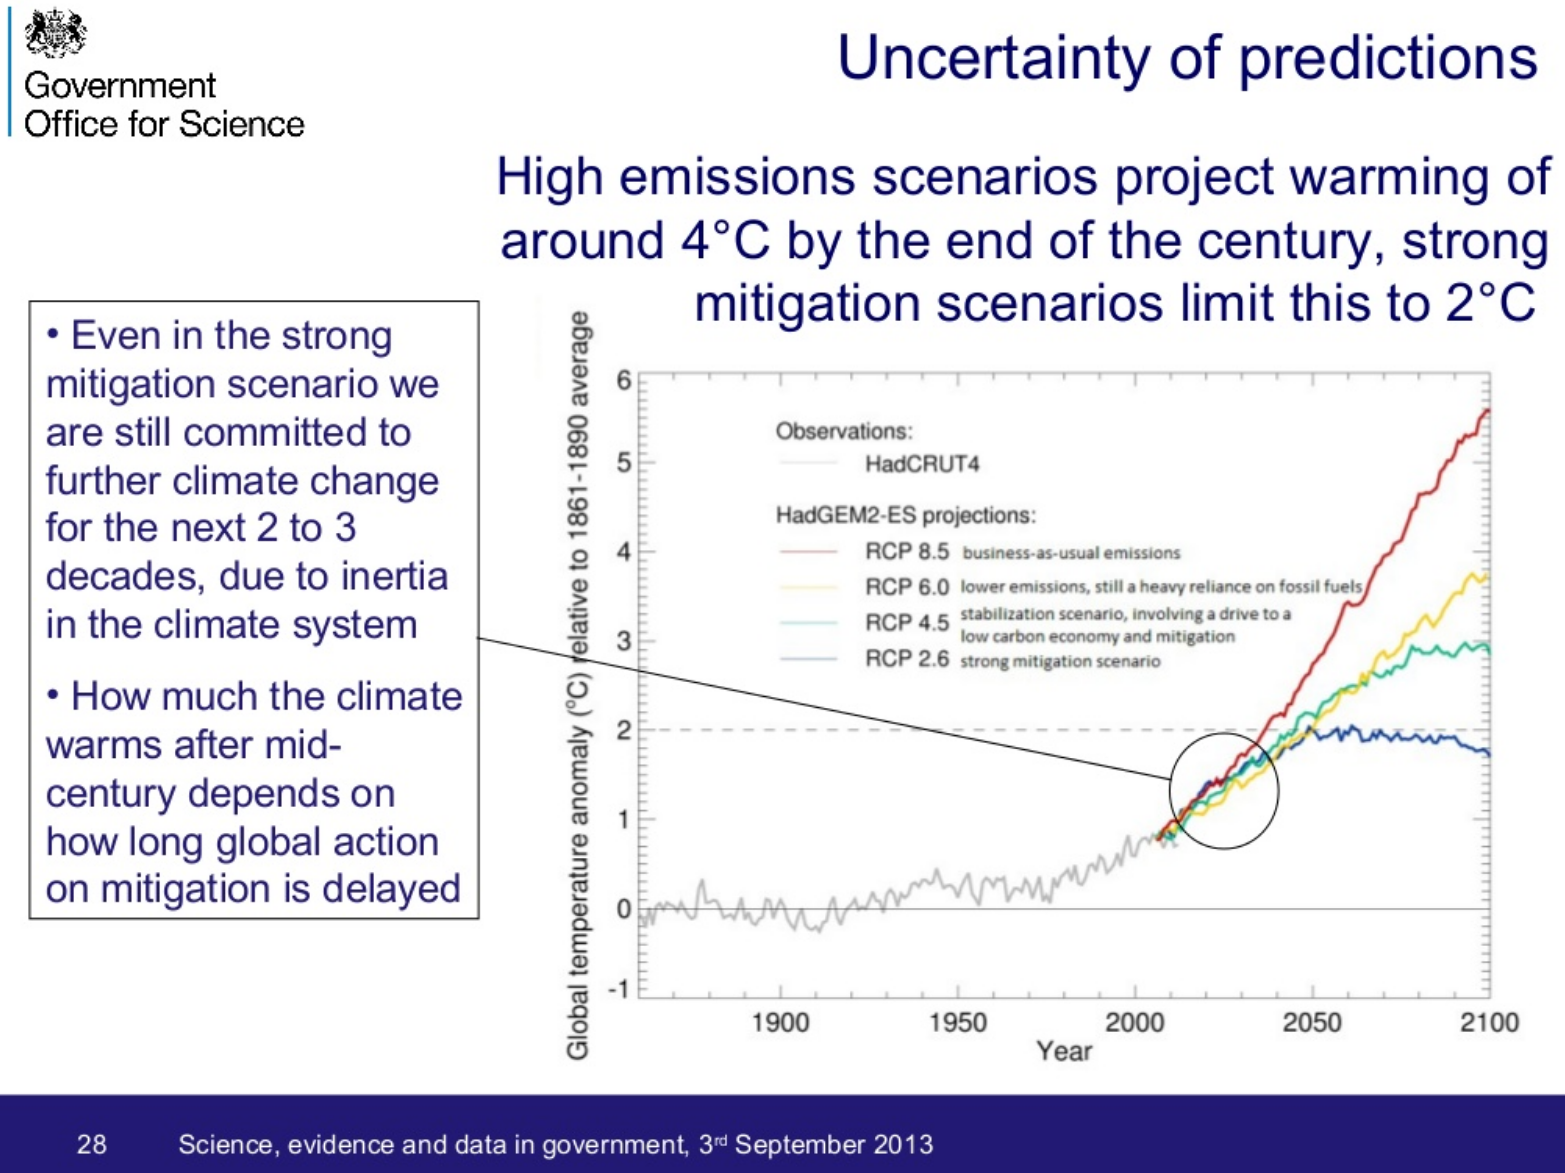
The Walport chart shows warming projections to 2100 from HadGEM2-ES, the Met Office’s flagship climate model, used for policy advice (http://www.metoffice.gov.uk/climate-change/policy-relevant/advance).
My graphic shows projected global warming at 2100 under Walport’s highest emissions scenario, RCP8.5, and does show 5-95% uncertainty ranges.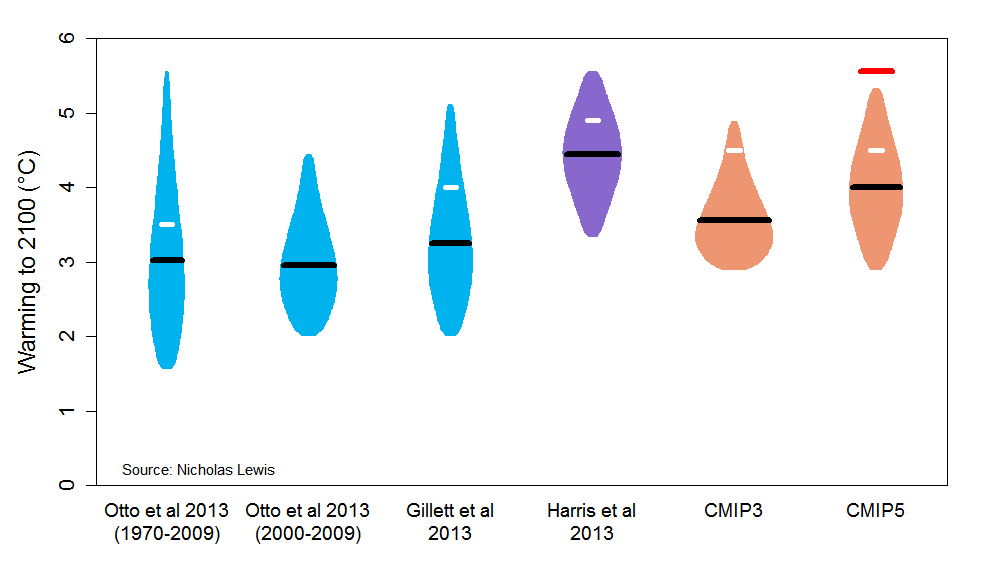 The red bar in the CMIP5 column shows HadGEM-ES. The flasks show, between the 5th and 95th percentiles of uncertainty distributions, the estimated probability density for each source: blue for observation-based studies, using data ending in two different periods for Otto et al; purple for the Harris et al 2013 Met Office study corresponding to the official UK climate projections (UKCP09); salmon for climate models – CMIP3 (last generation: IPCC AR4) and CMIP5 (current generation). Black bars are 50th percentiles (medians). The warming to 2100 is from pre-industrial times, and should be little different from warming from circa 1900.
The warming to 2100 for HadGEM2-ES on the RCP8.5 scenario is about 5.5°C both in my graphic and the Walport chart. Note that we have already had a global temperature rise of circa 0.8°C since the second half of the 19th century, so there is less to come than appears from the graphic.
My estimates are arrived at in the same way as in the Met Office July report “The recent pause in global warming (3): What are the implications for projections of future warming?“, Figure 2, but after correcting errors in their calculations. The short white bars show the original Met Office central estimates, all miscalculated. Additionally, their Report states that these are all medians, which is incorrect. They are in fact a mixture of means and medians. In two of the three cases where they used the mean it is about 10% higher than the median, which provides a better central estimate.
In my figure, HadGEM2-ES is a clear outlier. And the Harris et al 2013 probabilistic estimates, which should correspond to the UK official climate projections, have a probability weighting very much concentrated towards the top end of what warming observational studies indicate is likely. The Harris et al. 2013 estimate was based on perturbing parameters controlling variable characteristics of the previous generation Met Office climate model, HadCM3, and comparing the resulting simulations with observations of the recent mean climate and historical climate change. But its results appear mainly to reflect structural characteristics of HadCM3.
Statistical uncertainty in projected warming between different runs of the HadGEM2-ES, arising from simulated internal variability (climate noise), will be minor compared to the differences between the warming to 2100 per HadGEM2-ES and the observationally-based estimates.
Nicholas Lewis
Leave A Comment