Originally posted on May 19, 2013 at Bishop Hill
Readers may recall that last December I published an informal climate sensitivity study at Bishop Hill, here [local copy here]. The study adopted a heat-balance (energy budget) approach and used recent data, including satellite-observation-derived aerosol forcing estimates. I would like now to draw attention to a new peer-reviewed climate sensitivity study published as a Letter in Nature Geoscience, “Energy budget constraints on climate response”, here. This study uses the same approach as mine, based on changes in global mean temperature, forcing and heat uptake over 100+ year periods, with aerosol forcing adjusted to reflect satellite observations. Headline best estimates of 2.0°C for equilibrium climate sensitivity (ECS) and 1.3°C for the – arguably more policy-relevant – transient climate response (TCR) are obtained, based on changes to the decade 2000–09, which provide the best constrained, and probably most reliable, estimates. The 5–95% uncertainty ranges are 1.2–3.9°C for ECS and 0.9–2.0°C for TCR. I should declare an interest in this study: you will find my name included in the extensive list of authors: Alexander Otto, Friederike E. L. Otto, Olivier Boucher, John Church, Gabi Hegerl, Piers M. Forster, Nathan P. Gillett, Jonathan Gregory, Gregory C. Johnson, Reto Knutti, Nicholas Lewis, Ulrike Lohmann, Jochem Marotzke, Gunnar Myhre, Drew Shindell, Bjorn Stevens, and Myles R. Allen. I am writing this article in my personal capacity, not as a representative of the author team.
The Nature Geoscience paper, although short, is in my view significant for two particular reasons.
First, using what is probably the most robust method available, it establishes a well-constrained best estimate for TCR that is nearly 30% below the CMIP5 multimodel mean TCR of 1.8°C (per Forster et al. (2013), here). The 95% confidence bound for the Nature Geoscience paper’s 1.3°C TCR best estimate indicates some of the highest-response general circulation models (GCMs) have TCRs that are inconsistent with recent observed changes. Some two-thirds of the CMIP5 models analysed in Forster et. al (2013) have TCRs that lie above the top of the ‘likely’ range for that best estimate, and all the CMIP5 models analysed have an ECS that exceeds the Nature Geoscience paper’s 2.0°C best estimate of ECS. The CMIP5 GCM with the highest TCR, per the Forster et. al (2013) analysis, is the UK Met. Office’s flagship HadGEM2-ES model – see their webpage “Advanced climate modelling for policymakers” and their document “Advance: Improved advice for science mitigation advice”. The uncertainty distribution for the Nature Geoscience paper’s best TCR estimate of 1.3°C indicates that it is extremely unlikely that real-world TCR is as high as that of the HadGEM2-ES model. It has a TCR of 2.5°C, nearly double 1.3°C and 0.5°C beyond the top of the 5–95% uncertainty range. The paper obtains similar, albeit less well constrained, best estimates using data for earlier periods than 2000–09.
Secondly, the authors include fourteen climate scientists, well known in their fields, who are lead or coordinating lead authors of IPCC AR5 WG1 chapters that are relevant to estimating climate sensitivity. Two of them, professors Myles Allen and Gabi Hegerl, are lead authors for Chapter 10, which deals with estimates of ECS and TCR constrained by observational evidence. The study was principally carried out by a researcher, Alex Otto, who works in Myles Allen’s group.
Very helpfully, Nature’s editors have agreed to make the paper’s main text freely available for a limited period. I would encourage people to read the paper, which is quite short. The details given in the supplementary information (SI) enable the study to be fully understood, and its results replicated. The method used is essentially the same as that employed in my December study, being a more sophisticated version of that used in the Gregory et al. (2002) heat-balance-based climate sensitivity study, here. The approach is to draw sets of samples from the estimated probability distributions applicable to the radiative forcing produced by a doubling of CO2-equivalent greenhouse gas atmospheric concentrations (F2×) and those applicable to the changes in mean global temperature, radiative forcing and Earth system heat uptake (ΔT, ΔF and ΔQ), taking into account that ΔF is closely correlated with F2×. Gaussian (normal) error and internal climate variability distributions are assumed. ECS and TCR values are computed from each set of samples using the equations:
(1) ECS = F2× ΔT / (ΔF − ΔQ) and (2) TCR = F2× ΔT / ΔF .
With sufficient sets of samples, probability density functions (PDFs) for ECS and TCR can then be obtained from narrow-bin histograms, by counting the number of times the computed ECS and TCR values fall in each bin. Care is needed in dealing with samples where any of the factors in the equations are negative, to ensure that each is correctly included at the low or high end when calculating confidence intervals (CIs). Negative factors occur in a modest, but significant, proportion of samples when estimating ECS using data from the 1970s or the 1980s.
Estimates are made for ECS and TCR using ΔT, ΔF and ΔQ derived from data for the 1970s, 1980s, 1990s, 2000s and 1970–2009, relative to that for 1860–79. The estimates from the 2000s data are probably the most reliable, since that decade had the strongest forcing and, unlike the 1990s, was not affected by any major volcanic eruptions. However, although the method used makes allowance for internal climate system variability, the extent to which confidence should be placed in the results from a single decade depends on how well they are corroborated by results from a longer period. It is therefore reassuring that, although somewhat less well constrained, the best estimates of ECS and TCR using data for 1970–2009 are closely in line with those using data for the 2000s. Note that the validity of the TCR estimate depends on the historical evolution of forcing approximating the 70-year linear ramp that the TCR definition involves. Since from the mid-twentieth century onwards greenhouse gas levels rose much faster than previously, that appears to be a reasonable approximation, particularly for changes to the 2000s.
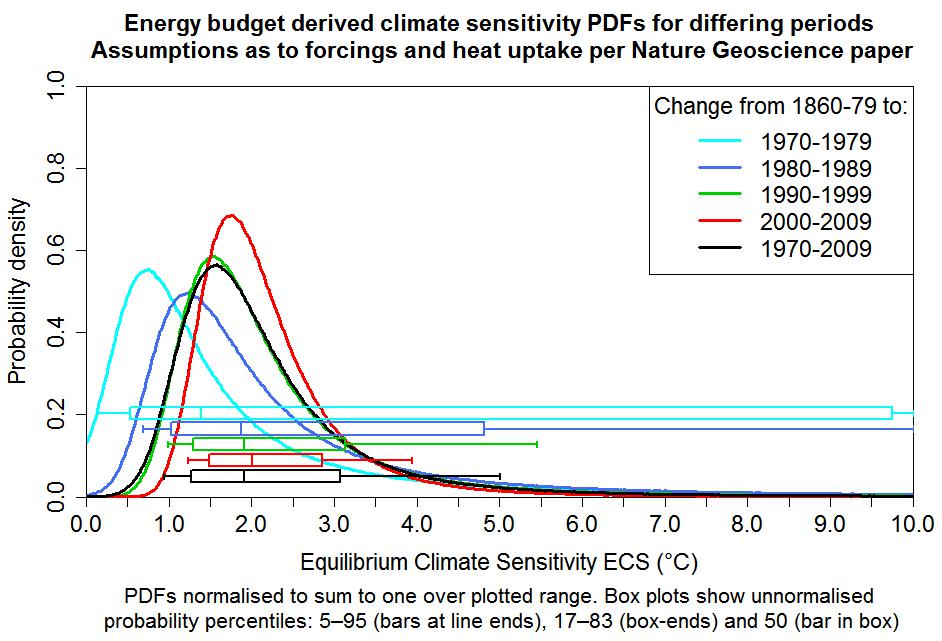
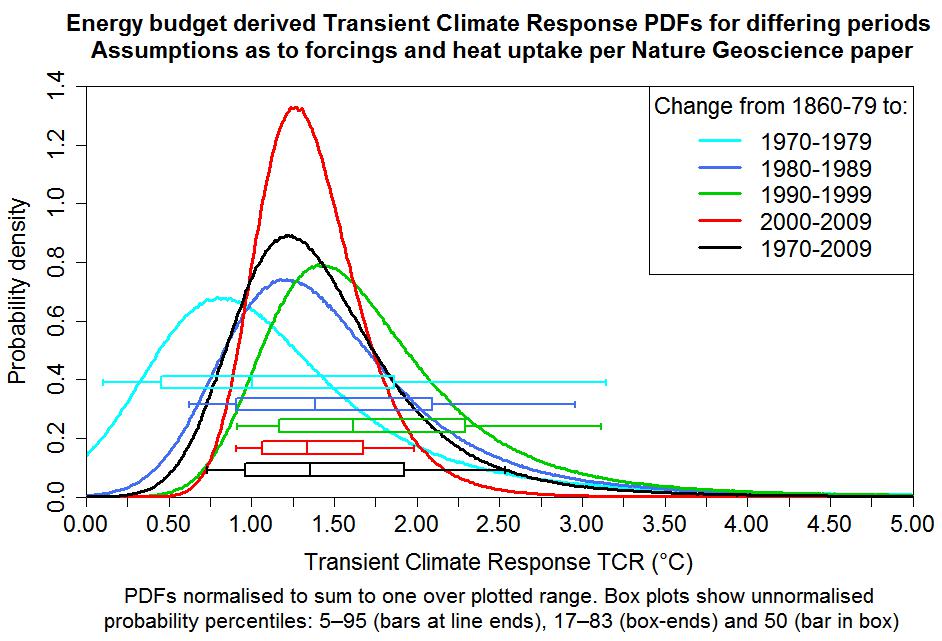
I have modified the R-code I used for my December study so that it computes and plots PDFs for each of the five periods used in the Nature Geoscience study for estimating ECS and TCR. The resulting ECS and TCR graphs, below, are not as elegant as the confidence region graphs in the Nature Geoscience paper, but are in a more familiar form. For presentation purposes, the PDFs (but not the accompanying box-and-whisker plots) have been truncated at zero and the upper limit of the graph and then normalised to unit total probability. Obviously, these charts do not come from the Nature Geoscience paper and are not to be regarded as associated with it. Any errors in them are entirely my own.
The box-and-whisker plots near the bottom of the charts are perhaps more important than the PDF curves. The vertical whisker-end bars and box-ends show (providing they are within the plot boundaries) respectively 5–95% and 17–83% CIs – ‘very likely’ and ‘likely’ uncertainty ranges in IPCC terminology – whilst the vertical bars inside the boxes show the median (50% probability point). For ECS and TCR, whose PDFs are skewed, the median is arguably in general a better central estimate than the mode of the PDF (the location of its peak), which varies according to how skewed and badly-constrained the PDF is. The TCR PDFs (note the halved x-axis scaling), which are unaffected by ΔQ and uncertainty therein, are all better constrained than the ECS PDFs.
The Nature Geoscience ECS estimate based on the most recent data (best estimate 2.0°C, with a 5–95% CI of 1.2–3.9°C) is a little different from that per my very similar December study (best estimate 1.6°C, with a 5–95% CI of 1.0–2.9°C, rounding outwards). The (unstated) TCR estimate implicit in my study, using Equation (2), was 1.3°C, with a 5–95% range of 0.9–2.0°C, precisely in line with the Nature Geoscience paper. In the light of these comparisons, I should perhaps explain the main differences in the data and methodology used in the two studies:
1) The main difference of principle is that the Nature Geoscience study uses GCM-derived estimates of ΔF and F2×. Multimodel means from CMIP5 runs per Forster et al. (2013) can thus be used as a peer-reviewed source of forcings data. ΔF is accordingly based on simulations reflecting the modelled effects of RCP 4.5 scenario greenhouse gas concentrations, aerosol abundances, etc. My study instead used the RCP 4.5 forcings dataset and the F2× figure of 3.71°C reflected in that dataset; I adjusted the projected post-2006 solar and volcanic forcings to conform them with estimated actuals. Use of CMIP5-based forcing data results in modestly lower estimates for both ΔF and F2× (3.44°C for F2×). Since CO2 is the dominant forcing agent, and its concentration is accurately known, the value of ΔF is closely related to the value of F2×. The overall effect of the difference in F2× on the estimates of ECS and TCR is therefore small. As set out in the SI, an adjustment of +0.3 Wm−2 to 2010 forcing was made in the Nature Geoscience study in the light of recent satellite-observation constrained estimates of aerosol forcing. On the face of it, the resulting aerosol forcing is slightly more negative than that used in my December study.
2) The Nature Geoscience study derives ΔQ using the change in estimated 0–2000 m ocean heat content (OHC) – which accounts for most of the Earth system heat uptake – from the start to the end of the relevant decade (or 1970–2009), whereas I computed a linear regression slope estimate using data for all years in the period I took (2002–11). Whilst I used the NODC/NOAA OHC data, which corresponds to Levitus et al. (2012), here, for the entire 0–2000 m ocean layer, the Nature Geoscience study splits that layer between 0–700 m and 700–2000 m. It retains the NODC/NOAA Levitus OHC data for the 700–2000 m layer but uses a different dataset for 0–700 m OHC – an update from Domingues et al. (2008), here.
3) The periods used for the headline results differ slightly. I used changes from 1871–80 to 2002–11, whilst the Nature Geoscience study uses changes from 1860–79 to 2000–09. The effects are very small if the CMIP5 GCM-derived forcing estimates are used, but when employing the RCP 4.5 forcings, switching to using changes from 1860–79 to 2000–09 increases the ECS and TCR estimates by around 0.05°C.
Since the Nature Geoscience study and my December study give identical estimates of TCR, which are unaffected by ΔQ, the difference in their estimates of ECS must come primarily from use of different ΔQ figures. The difference between the ECS uncertainty ranges of the two studies likewise almost entirely reflects the different central estimates for ΔQ they use. The ECS central estimate and 5–95% uncertainty range per my December heat-balance/energy budget study were closely in line with the preferred main results estimate for ECS, allowing for additional forcing etc. uncertainties, per my recent Journal of Climate paper, of 1.6°C with a 5–95% uncertainty range of 1.0–3.0°C. That paper used a more complex method which, although less robust, avoided reliance on external estimates of aerosol forcing.
The take-home message from this study, like several other recent ones, is that the ‘very likely’ 5–95% ranges for ECS and TCR in Chapter 12 of the leaked IPCC AR5 second draft scientific report, of 1.5–6/7°C for ECS and 1–3°C for TCR, and the most likely values of near 3°C for ECS and near 1.8°C for TCR, are out of line with instrumental-period observational evidence.


Leave A Comment