Originally posted on May 24, 2013 at Watts Up With That?
The Otto et al. paper has received a great deal of attention in recent days. While the paper’s estimate of transient climate response was low, the equilibrium/effective climate sensitivity figure was actually slightly higher than that in some other recent studies based on instrumental observations. Here, Nic Lewis notes that this is largely due to the paper’s use of the Domingues et al. upper ocean (0–700 m) dataset, which assesses recent ocean warming to be faster than other studies in the field. He examines the effects of updating the Otto et al. results from 2009 to 2012 using different upper ocean (0–700 m) datasets, with surprising results.
Last December I published an article here entitled ‘Why doesn’t the AR5 SOD’s climate sensitivity range reflect its new aerosol estimates?‘ (Lewis, 2012). In it I used a heat-balance (energy-budget) approach based on changes in mean global temperature, forcing and Earth system heat uptake (ΔT, ΔF and ΔQ) between 1871–80 and 2002–11. I used the RCP 4.5 radiative forcings dataset (Meinshausen et al, 2011), which is available in .xls format here, conformed it with solar forcing and volcanic observations post 2006 and adjusted its aerosol forcing to reflect purely satellite-observation-based estimates of recent aerosol forcing.
I estimated equilibrium climate sensitivity (ECS) at 1.6°C,with a 5–95% uncertainty range of 1.0‑2.8°C. I did not state any estimate for transient climate response (TCR), which is based on the change in temperature over a 70-year period of linearly increasing forcing and takes no account of heat uptake. However, a TCR estimate was implicit in the data I gave, if one makes the assumption that the evolution of forcing over the long period involved approximates a 70-year ramp. This is reasonable since the net forcing has grown substantially faster from the mid-twentieth century on than previously. On that basis, my best estimate for TCR was 1.3°C. Repeating the calculations in Appendix 3 of my original article without the heat uptake term gives a 5–95% range for TCR of 0.9–2.0°C.
The ECS and TCR estimates are based on the formulae:
(1) ECS = F2× ΔT / (ΔF − ΔQ) and (2) TCR = F2× ΔT / ΔF
where F2× is the radiative forcing corresponding to a doubling of atmospheric CO2 concentrations.
A short while ago I drew attention, here, to an energy-budget climate study, Otto et al. (2013), that has just been published in Nature Geoscience, here. Its author list includes fourteen lead/coordinating lead authors of relevant AR5 WG1 chapters, and myself. That study uses the same equations (1) and (2) as above to estimate ECS and TCR. It uses a CMIP5-RCP4.5 multimodel mean of forcings as estimated by general circulation models (GCMs) (Forster et al, 2013), likewise adjusting the aerosol forcing to reflect recent satellite-observation based estimates – see Supplementary Information (SI) Section S1. It Although the CMIP5 forcing estimates embody a lower figure for F2× (3.44 W/m2) than do those per the RCP4.5 database (F2×: 3.71 W/m2), TCR estimates from using the two different sets of forcing estimates are almost identical, whilst ECS estimates are marginally higher using the CMIP5 forcing estimates[i].
Although the Otto et al. (2013) Nature Geoscience study illustrates estimates based on changes in global mean temperature, forcing and heat uptake between 1860–79 and various recent periods, it states that the estimates based on changes to the decade to 2000–09 are arguably the most reliable, since that decade has the strongest forcing and is little affected by the eruption of Mount Pinatubo. Its TCR best estimate and 5–95% range based on changes to 2000-09 are identical to what is implicit in my December study: 1.3°C (uncertainty range 0.9–2.0°C).
While the Otto et al. (2013) TCR best estimate is identical to that implicit in my December study, its ECS best estimate and 5–95% range based on changes between 1860–79 to 2000–09 is 2.0°C (1.2–3.9°C), somewhat higher than the 1.6°C (1.0–2.9°C) per my study, which was based on changes between 1871–80 and 2002–11. About 0.1°C of the difference is probably accounted for by roundings and the difference in F2× factors due to the different forcing bases. But, given the identical TCR estimates, differences in the heat-uptake estimates used must account for most of the remaining 0.3°C difference between the two ECS estimates.
Both my study and Otto et al. (2013) used the pentadal estimates of 0–2000-m deep-layer ocean heat content (OHC) updated from Levitus et al. (2012), and made allowances in line with the recent studies for heat uptake in the deeper ocean and elsewhere. The two studies’ heat uptake estimates differed mainly due to the treatment of the 0–700-m layer of the ocean. I used the estimate included in the Levitus 0–2000-m pentadal data, whereas Otto et al. (2013) subtracted the Levitus 0–700-m pentadal estimates from that data and then added 3-year running mean estimates of 0–700-m OHC updated from Domingues et al (2008).
Since 2000–09, the most recent decade used in Otto et al. (2013), ended more than three years ago, I will instead investigate the effect of differing heat uptake estimates using data for the decade 2003–12 rather than for 2000–09. Doing so has two advantages. First, forcing was stronger during the 2003–12 decade, so a better constrained estimate should be obtained. Secondly, by basing the 0–700-m OHC change on the difference between the 3-year means for 2003–05 and for 2010–12, the influence of the period of switchover to Argo – with its higher error uncertainties – is reduced.
In this study, I will present results using four alternative estimates of total Earth system heat uptake over the most recent decade. Three of the estimates adopt exactly the same approach as in Otto et al. (2013), updating estimates appropriately, and differ only in the source of data used for the 3-year running mean 0–700-m OHC. In one case, I calculate it from the updated Levitus annual data, available from NOAA/NOCDC here. In the second case I calculate it from updated Lyman et al. (2010), data, available here. In the third case I use the updated Domingues et al. (2008) data archived at the CSIRO Sea Level Rise page in relation to Church et al. (2011), here. Since that data only extends to the mean for 2008–10, I have extended it for two years at a conservative (high) rate of 0.33 W/m2 – which over that period is nearly double the rate of increase per the Levitus dataset, and nearly treble that per the Lyman dataset. The final estimate uses total system heat uptake estimates from Loeb et al. 2012 and Stephens et al. 2012. Those studies melded satellite-based estimates of top-of-atmosphere radiative imbalance with ocean heat content estimates, primarily updated from the Lyman et al. (2010) study. The Loeb 2012 and Stephens 2012 studies estimated average total Earth system heat uptake/radiative imbalance at respectively 0.5 W/m2 over 2000–10 and 0.6 W/m2 over 2005–10. I take the mean of these two figures as applying throughout the 2003–12 period.
I use the same adjusted CMIP5-RCP4.5 forcings dataset as used in the Otto et al. (2013) study, updating them from 2000–09 to 2003–12, to achieve consistency with that study (data kindly supplied by Piers Forster). Likewise, the uncertainty estimates I use are derived on the same basis as those in Otto et al. (2013).
I am also retaining the 1860–79 base reference period used in Otto et al. (2013). That study followed my December study in deducting 50% of the 0.16 W/m2 estimate of ocean heat uptake (OHU) in the second half of the nineteenth century per Gregory et al. (2002), the best-known of the earlier energy budget studies. The 0.16 W/m2 estimate – half natural, half anthropogenic – seemed reasonable to me, given the low volcanic activity between 1820 and 1880. However, I deducted only 50% of it to compensate for my Levitus 2012-derived estimate of 0–2000-m ocean heat uptake being somewhat lower than that per some other estimates. Although the main reason for making the 50% reduction in the Gregory (2002) OHU estimate for 1861–1900 disappears when considering 0–700-m ocean heat uptake datasets with significantly higher trends than per Levitus 2012, in the present calculations I nevertheless apply the 50% reduction in all cases.
Table 1, below, shows comparisons of ECS and TCR estimates using data for the periods 2000–09 (Otto et al., 2013), 2002–11 (Lewis, 2012 – my December study) and 2003–12 (this study) using the relevant forcings and 0–700 m OHC datasets.
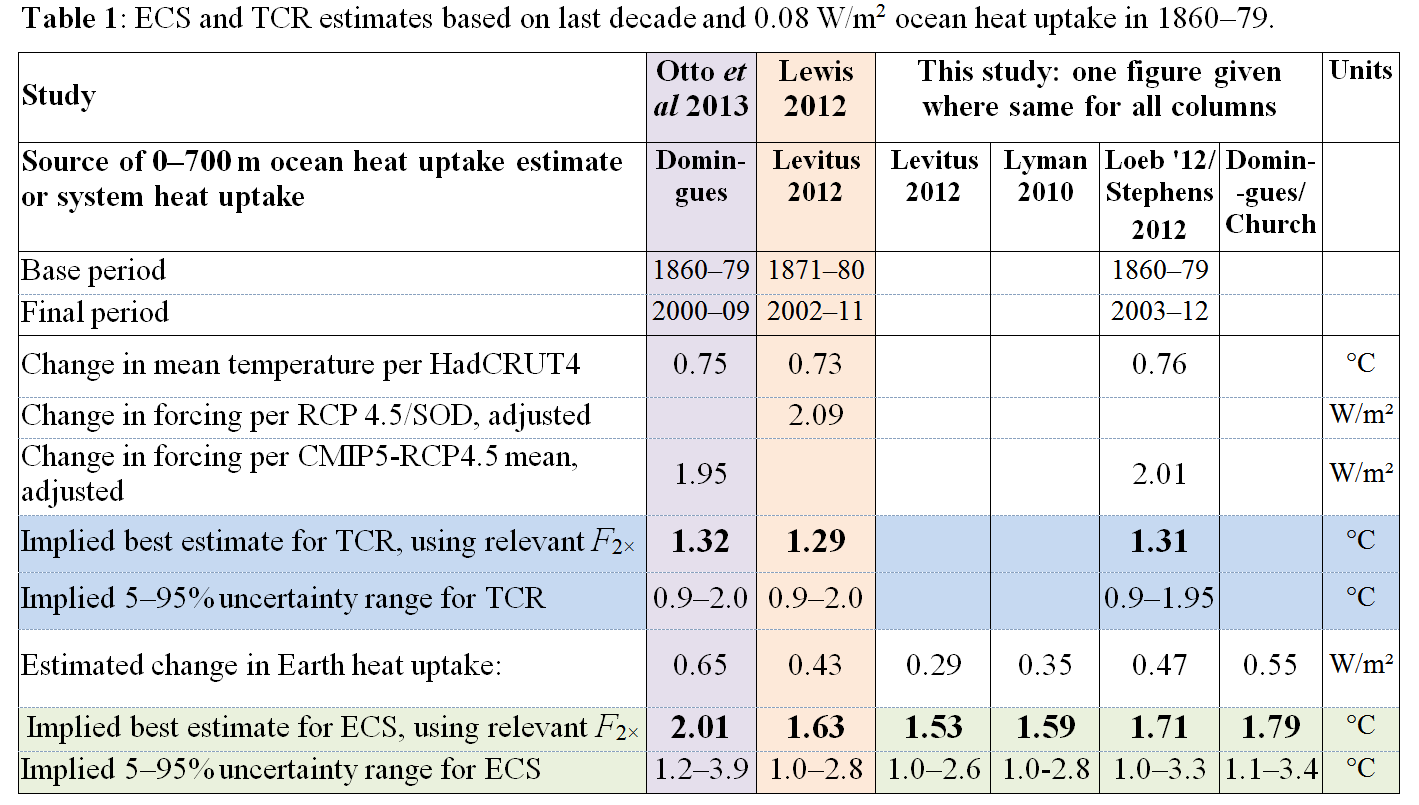
Whichever periods and forcings dataset are used, the best estimate of TCR remains 1.3°C. The 5–95% uncertainty range narrows marginally when using changes to 2003–12, giving slightly higher forcing increases, rather than to 2000–09 or 2002–11, rounding to 0.9–1.95°C. The ‘likely’ range (17–83%) is 1.05–1.65°C. (These figures are all rounded to the nearest 0.05°C.) The TCR estimate is unaffected by the choice of OHC dataset.
The ECS estimates using data for 2003–12 reveal the significant effect of using different heat uptake estimates. Lower system heat uptake estimates and the higher forcing estimates resulting from the 3-year roll-forward of the period used both contribute to the ECS estimates being lower than the Otto et al. (2013) ECS estimate, the first factor being the most important.
Although stating that estimates based on 2000–09 are arguably most reliable, Otto et al. (2013) also gives estimates based on changes to 1970–79, 1980–89, 1990–99 and 1970–2009. Forcings during the first two of those periods are too low to provide reasonably well-constrained estimates of ECS or TCR, and estimates based on 1990–99 may be unreliable since this period was affected both by the eruption of Mount Pinatubo and by the exceptionally large 1997–98 El Niño. However, the 1970–2009 period, although having a considerably lower mean forcing than 2000–09 and being more impacted by volcanic activity, should – being much longer – be less affected by internal variability than any single decade. I have therefore repeated the exercise carried out in relation to the final decade, in order to obtain estimates based on the long period 1973–2012.
Table 2, below, shows comparisons of ECS and TCR estimates using data for the periods 1900–2009 (Otto et al., 2013) and 1973–2012 (this study) using the relevant forcings and 0–700-m OHC datasets. The estimates of system heat uptake from two of the sources used for 2003–12 do not cover the longer period. I have replaced them by an estimate based on data, here, updated from Ishii and Kimoto (2009). Using 2003–12 data, the Ishii and Kimoto dataset gives almost an identical ECS best estimate and uncertainty range to the Lyman 2010 dataset, so no separate estimate for it is shown for that period. Accordingly, there are only three ECS estimates given for 1973–2012. Again, the TCR estimates are unaffected by the choice of system heat uptake estimate.
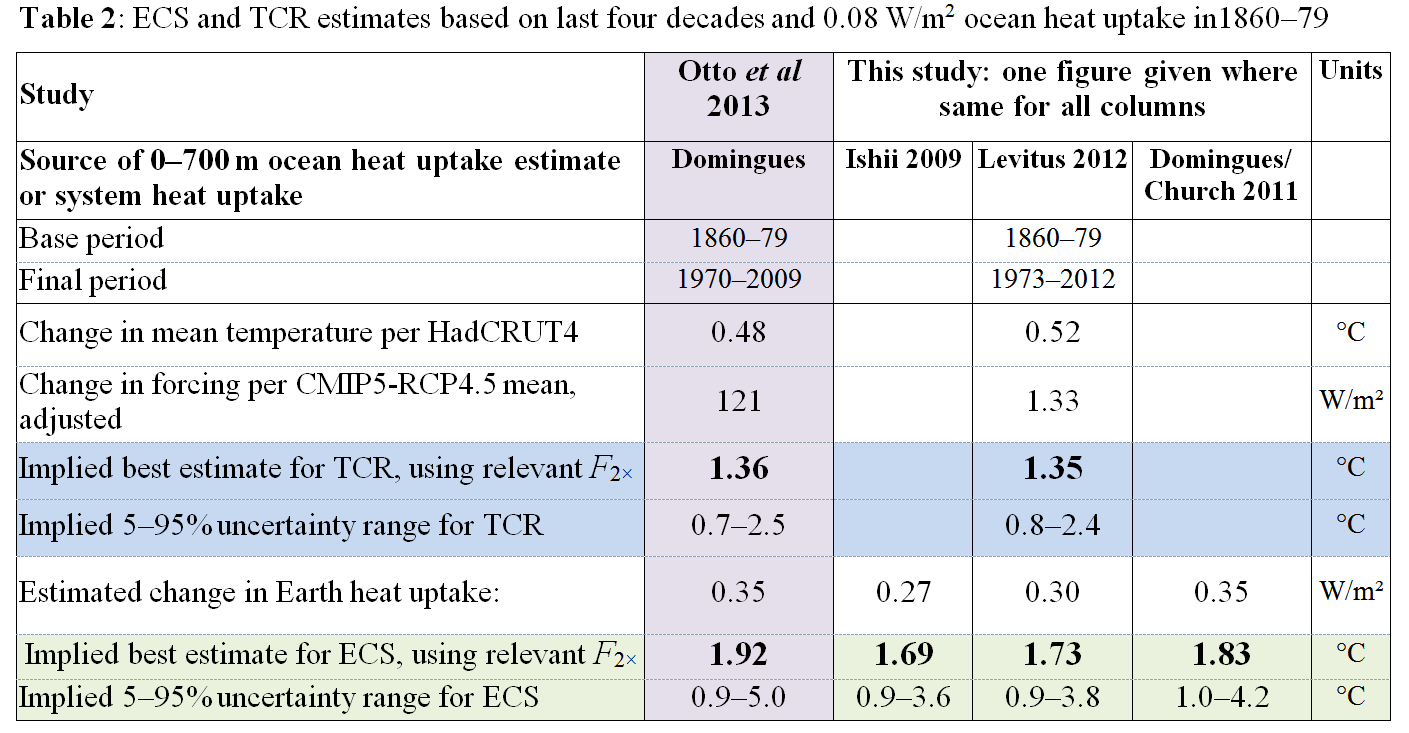
The first thing to note is that the TCR best estimate is almost unchanged from that per Otto et al. (2013): just marginally lower at 1.35°C. That is very close to the TCR best estimate based on data for 2003–12. The 5–95% uncertainty range for TCR is slightly narrower than when using data for 1972–2012 rather than 1970–2009, due to higher mean forcing.
Table 2 shows that ECS estimates over this longer period vary considerably less between the different OHC datasets (two of which do not cover this period) than do estimates using data for 2003–12. As in Table 1, all the 1973–2012 based ECS estimates come in below the Otto et al. (2013) one, both as to best estimate and 95% bound. Giving all three estimates equal weight, a best estimate for ECS of 1.75°C looks reasonable, which compares to 1.9°C per Otto et al. (2013). On a judgemental basis, a 5–95% uncertainty range of 0.9–4.0°C looks sufficiently wide, and represents a reduction of 1.0°C in the 95% bound from that per Otto et al. (2013).
If one applied a similar approach to the four, arguably more reliable, ECS estimates from the 2003–12 data, the overall best estimate would come out at 1.65°C, considerably below the 2.0°C per Otto et al. (2013). The 5–95% uncertainty range calculated from the unweighted average of the PDFs for the four estimates is 1.0–3.1°C, and the 17–83%, ‘likely’, range is 1.3–2.3°C. The corresponding ranges for the Otto et al. (2013) study are 1.2–3.9°C and 1.5–2.8°C. The important 95% bound on ECS is therefore reduced by getting on for 1°C.
Nicholas Lewis
References
Church, J. A. et al. (2011): Revisiting the Earth’s sea-level and energy budgets from 1961 to 2008. Geophysical Research Letters 38, L18601, doi:10.1029/2011gl048794.
Domingues, C. M. et al. (2008): Improved estimates of upper-ocean warming and multi-decadal sea-level rise. Nature453, 1090-1093, doi:http://www.nature.com/nature/journal/v453/n7198/suppinfo/nature07080_S1.html.
Forster, P. M., T. Andrews, P. Good, J. M. Gregory, L. S. Jackson, and M. Zelinka (2013): Evaluating adjusted forcing and model spread for historical and future scenarios in the CMIP5 generation of climate models, J. Geophys. Res. Atmos., 118, doi:10.1002/jgrd.50174
Ishii, M. and M. Kimoto (2009): Reevaluation of historical ocean heat content variations with time-varying XBT and MBT depth bias corrections. J. Oceanogr., 65, 287 – 299.
Levitus, S. et al. (2012): World ocean heat content and thermosteric sea level change (0–2000 m), 1955–2010. Geophysical Research Letters39, L10603, doi:10.1029/2012gl051106.
Loeb, NG et al. (2012): Observed changes in top-of-the-atmosphere radiation and upper-ocean heating consistent within uncertainty. Nature Geoscience, 5, 110-113.
Lyman, JM et al. (2009): Robust warming of the global upper ocean. Nature, 465, 334–337. http://www.nature.com/nature/journal/v465/n7296/full/nature09043.html
Meinshausen M., S. Smith et al. (2011): The RCP greenhouse gas concentrations and their extension from 1765 to 2500. Climate Change, Special RCP Issue
Otto, A. et al. (2013): Energy budget constraints on climate response. Nature Geoscience, doi:10.1038/ngeo1836
Stephens, GL et al (2012): An update on Earth’s energy balance in light of the latest global observations. Nature Geoscience, 5, 691-696
[i]Total forcing after adjusting the aerosol forcing to match observational estimates is not far short of total long-lived greenhouse gas (GHG) forcing. Therefore, differing estimates of GHG forcing – assuming that they differ broadly proportionately between the main GHGs – change both the numerator and denominator in Equation (1) by roughly the same proportion. Accordingly, differing GHG forcing estimates do not matter very much when estimating TCR, provided that the corresponding F2× is used to calculate the ECS and TCR estimates, as was the case for both my December study and Otto et al. (2013). ECS estimates will be more sensitive than TCR estimates to differences in F2× values, since the unvarying deduction for heat uptake means that the (ΔF − ΔQ) factor in equation (2) will be affected proportionately more than the F2× factor. All other things being equal, the lower CMIP5 F2× value will lead to ECS estimates based on CMIP5 multimodel mean forcings being nearly 5% higher than those based on RCP4.5 forcings.
Leave A Comment