A pdf version of this article is available here
I thought it was time for an update of my original analysis of 28 June 2020. As I wrote then, the course of the COVID-19 pandemic in Sweden is of great interest, as it is one of very few advanced nations where no lockdown order that heavily restricted people’s movements and other basic freedoms was imposed. Unfortunately, some of the comment on how the COVID-19 epidemic has developed in Sweden has been ill-informed. Indeed, a shadowy group of academics, opinion leaders, researchers and others who are upset about Sweden’s strategy and are actively seeking to influence it has been unmasked. They have been coordinating efforts to criticize media coverage of Sweden’s strategy and to damage both the image of Sweden abroad and the reputation of individuals who work in this field.
I present here updated plots of weekly new cases and deaths, with accompanying comments.[1]
Key Points
- Despite Swedish Covid cases falling to low levels in the summer, they resurged in the autumn
- This second wave, which was very likely a seasonal effect, now appears past its peak
- Excess deaths in East Sweden were high in the first wave and low in the second; for South Sweden the opposite is true. This suggests that population immunity and/or the remaining number of frail old people are key factors in the severity of the second wave.
- Excess deaths in Sweden to end 2020 were modest, particularly for 2019 (when deaths were abnormally low) and 2020 combined. They appear to be much lower relative to the population than in England, despite far harsher restrictions being imposed there.
- Only 3% of recorded 2020 COVID-19 deaths in Sweden were of people aged under 60
Overall development of the epidemic
Figure 1 shows the overall picture for confirmed weekly total new COVID-19 cases, intensive care admissions and deaths in Sweden, up to data released on 9 February 2021. The criteria for testing were widened during the early months, so case numbers up to June 2020 are not comparable with subsequent ones. Weekly new cases have been divided by 50 in order to make their scale comparable to that for ICU admissions and deaths. Death numbers for the two final weeks will be noticeably understated due to delays in death registrations.
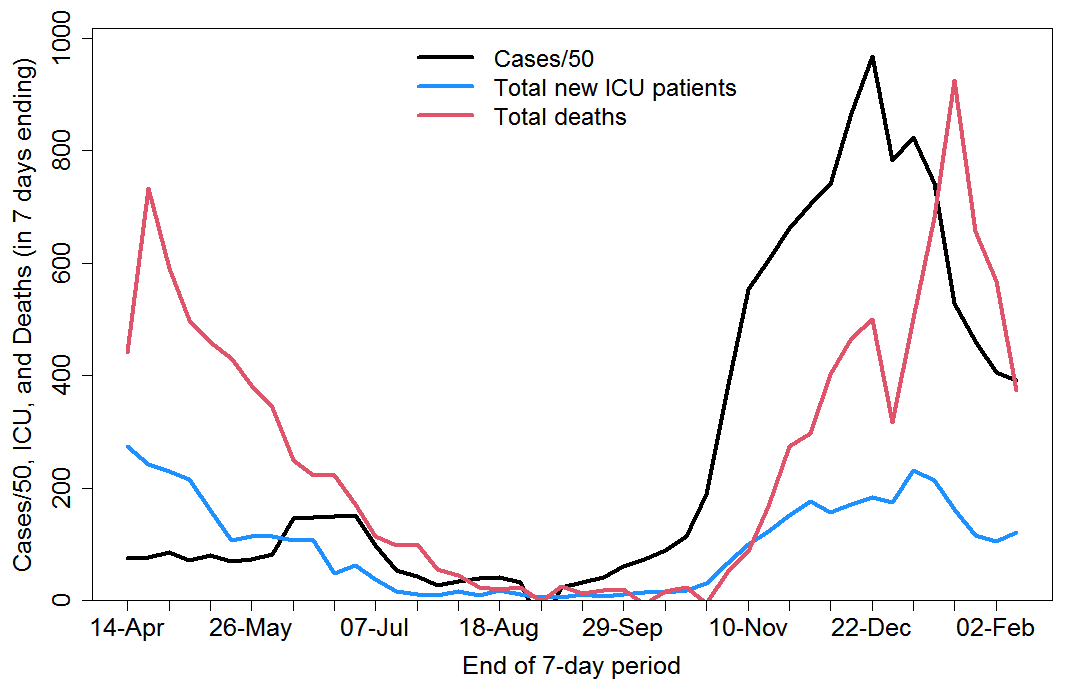
Fig. 1 Total weekly COVID-19 confirmed cases, intensive care admissions and deaths in Sweden
In late summer 2020 it looked as if the epidemic had burnt itself out, however a strong second wave developed during September to December. Although start of school and university term, along with more relaxed behaviour, may have started the second wave off, over the period as a whole the primary driver was almost certainly a seasonal increase in the virus’s transmission and hence reproduction number. Studies that indicated a lack of substantial seasonality in transmission[2] [3] have been proven wrong.
Analysis by age group
The changing age composition of new cases over time is shown in Figure 2. Case numbers before and after June 2020 are not comparable because of the major widening of testing during June 2020. However, it is clear that the second wave has been dominated by infections of people aged 10 to 59 years.
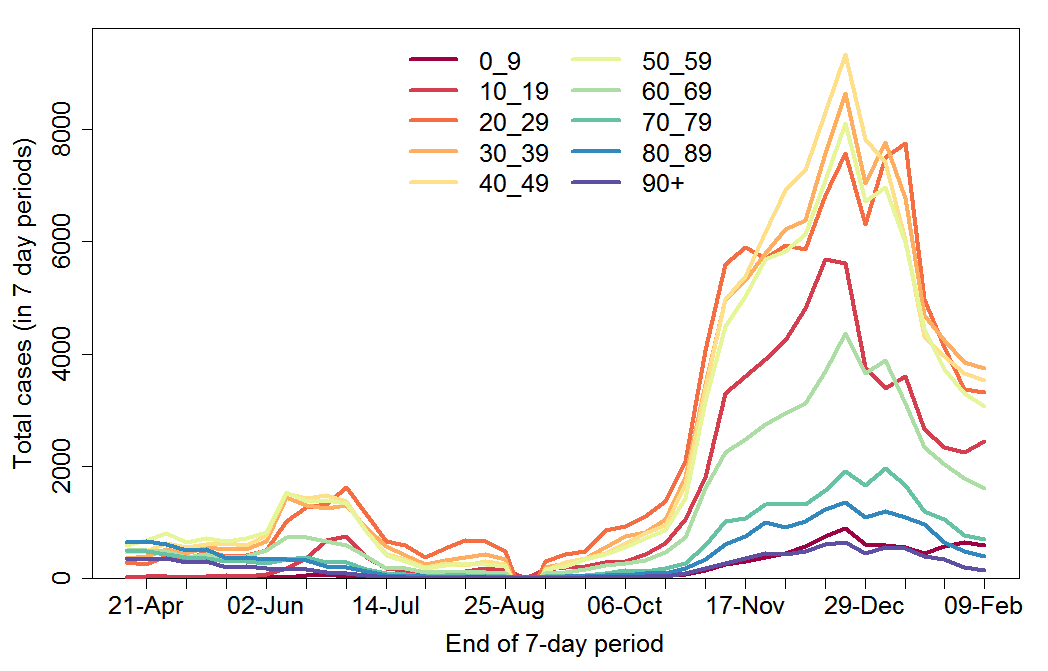
Fig. 2 Weekly COVID-19 confirmed cases by age group in Sweden
After falling to very low levels in late July 2020, weekly COVID-19 recorded deaths rose strongly from late October on, across all age groups (Figure 3). The data show the number of people with confirmed COVID-19 who died, regardless of the cause of death. In total, about 50% of deaths occurred up to and after 30 September 2020, that is in the first wave and in the second wave (which is, however, not over yet). During the second wave, a slightly higher proportion of deaths have been of people aged 80+ years than in the first wave.
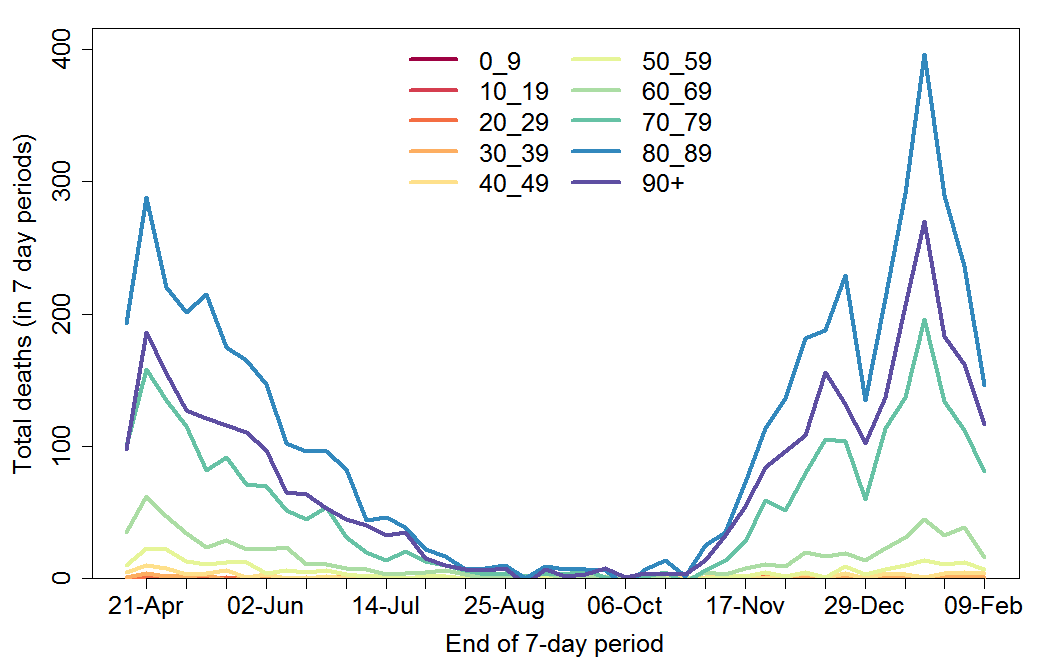
Fig. 3 Weekly COVID-19 recorded deaths by age group in Sweden
Regional analysis
I turn now to regional analysis. Figure 4 shows weekly confirmed new cases for each of the 21 regions in Sweden. Although widening of testing (mainly in the second quarter of 2020) varied between regions, it is evident that Stockholm and Västra Götaland, which dominated cases during the first wave, were also two of the three regions dominating the second wave, with Stockholm region leading both waves. However, while Skåne had relatively few first wave cases, it broadly matched Stockholm in the second wave, albeit with a delay. Cases have fallen quite sharply in almost all regions since the turn of the year.
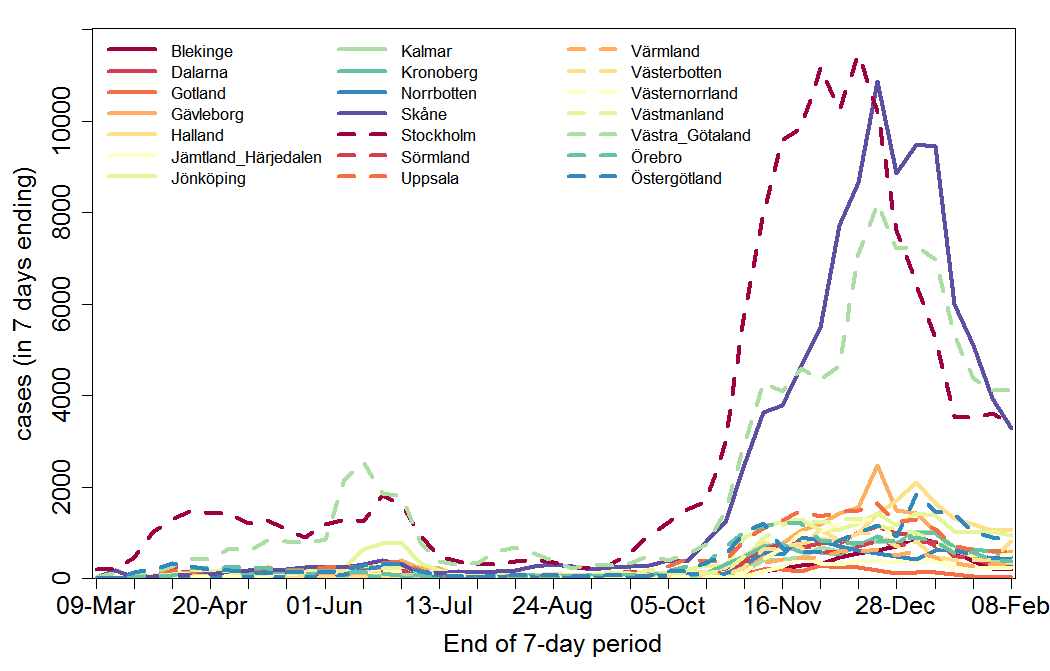
Fig. 4 Weekly COVID-19 confirmed cases by region in Sweden
Regions have varying populations, so confirmed cases per 100,000 head of population give a better picture of relative disease incidence (Figure 5). There is negligible correlation between the regions that had the highest incidence of COVID-19 cases during the first wave (including or excluding June to August) and the post-September 2020 period. In the absence of growing population immunity having an effect, one might expect that in those regions in which the virus spread most easily prior to September 2020 (by which time it was well ensconced in all regions) – for instance, due to greater urbanisation – it would also have spread most easily in the second wave, in the absence of changes in other factors. A lack of correlation between cases in the first and second waves is consistent with greater population immunity in those regions that were harder hit in the first wave counteracting, during the second wave, the greater ease with which infections spread there when population immunity was low.
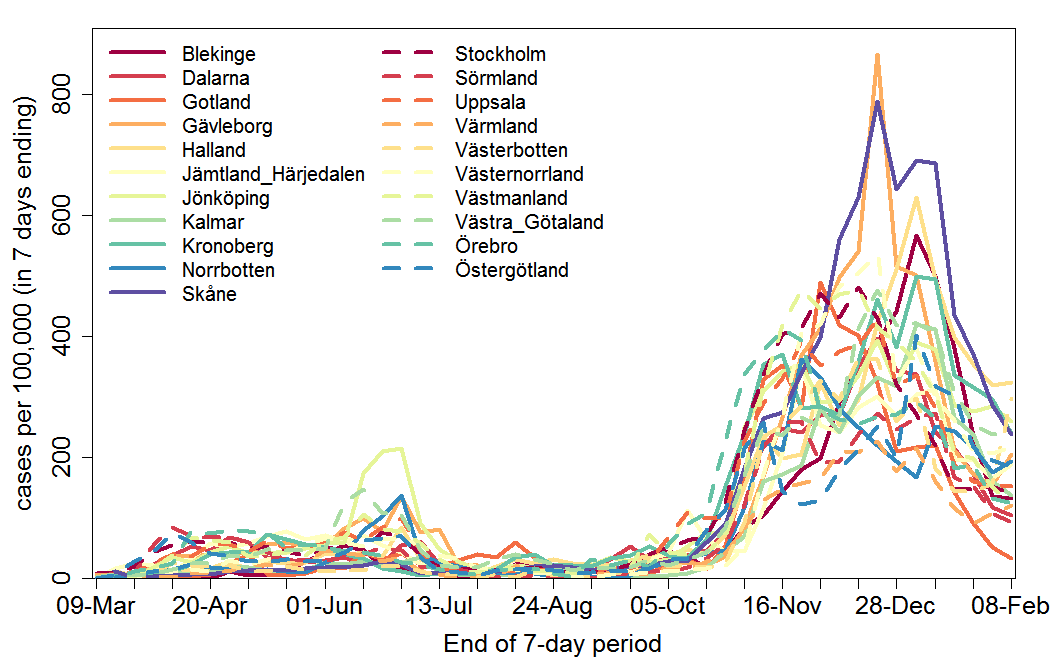
Fig. 5 Weekly COVID-19 confirmed cases per 100,000 head of population by region in Sweden
As for cases, it is difficult to discern an obvious relationship across regions between COVID-19 deaths per 100,000 people in the first and the second waves, and the correlation between them is negligible. The non-identity between recorded COVID-19 deaths and those actually caused by the disease may be one reason for this. A somewhat clearer picture comes from examining weekly excess deaths in geographical super-regions, as shown in a recent Swedish report.[4]
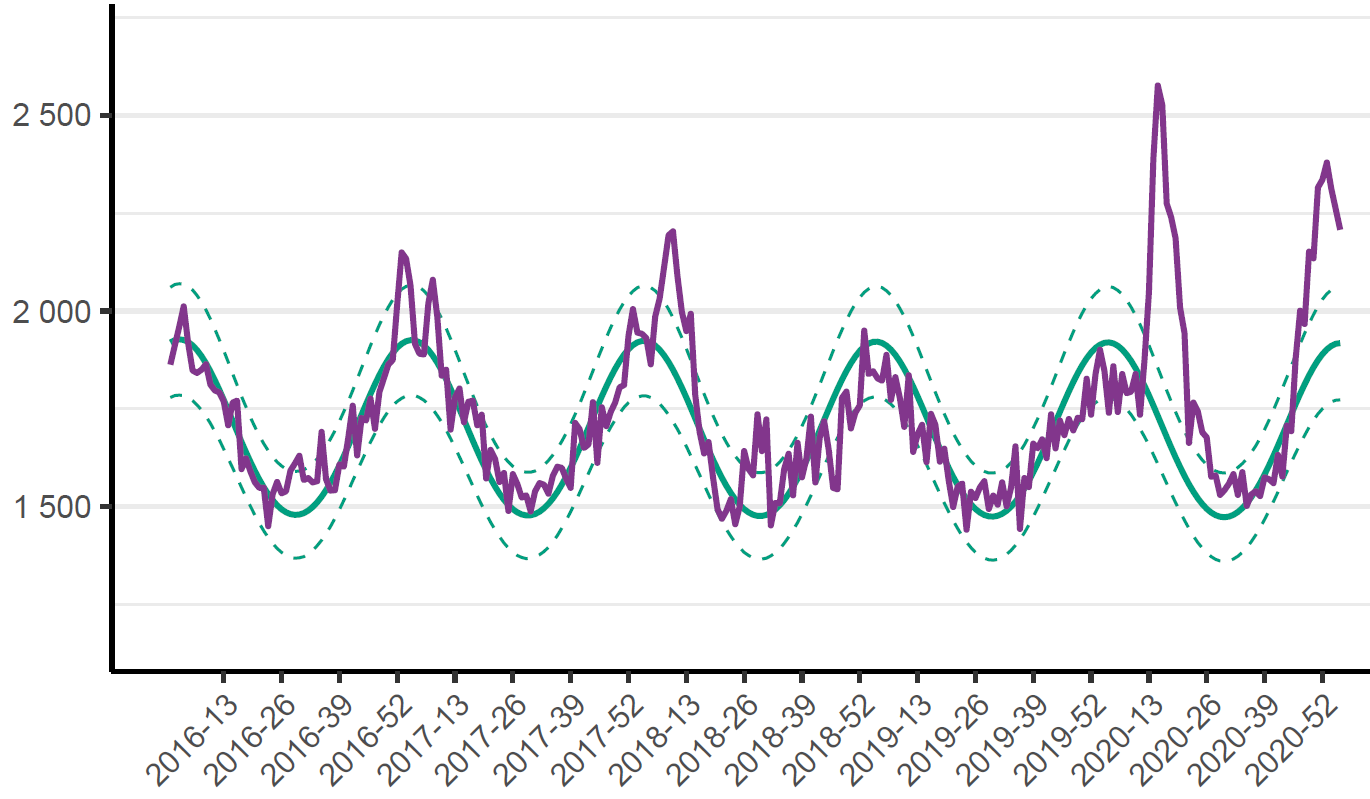
Fig. 6 Weekly deaths (purple line) up to week 3 of 2021 in Sweden compared with the expected normal death toll (solid green line) and its 95% confidence interval (dashed green line)
Figure 6 shows the position for Sweden as a whole. Data go up to week 3 2021; data for more recent weeks are incomplete. Peak excess deaths were higher in the first wave than in the second wave, the opposite relationship to that for recorded COVID-19 deaths. While this likely partly reflects an element of undercounting of deaths caused by COVID-19 at the peak of the first wave, it appears to be mainly due more to a considerably larger over counting of COVID-19 deaths throughout the second wave. While the second wave is not over yet, it does appear that excess deaths have peaked.
Figure 7 shows deaths for East Sweden, the population of which is dominated by Stockholm region. Excess deaths in the first COVID-19 wave were further above normal than for Sweden as a whole, but excess deaths during the second wave peaked at a level not much above that in the 2017/18 flu and pneumonia season, and fell back within the 95% confidence interval by the end of 2020 (and to close to normal for Stockholm region alone).
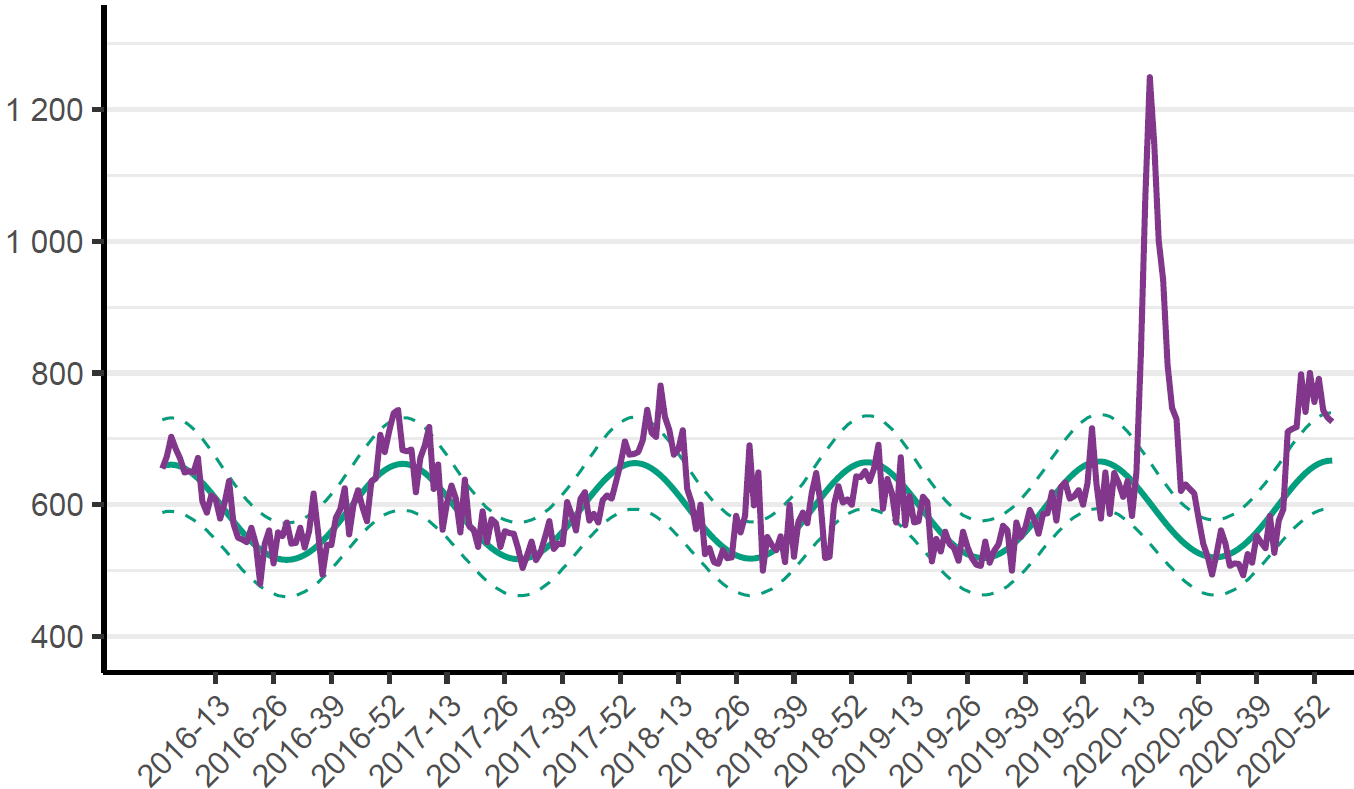
Fig. 7 As Figure 6 but for East Sweden (Stockholm, Uppsala, Södermanland, Östergötland, Örebro, Västmanland)
However, in Southern Sweden, the picture is quite different (Figure 8), with the second wave of COVID-19 excess deaths being considerably larger than the first, which was smaller than in the 2017/18 flu season.
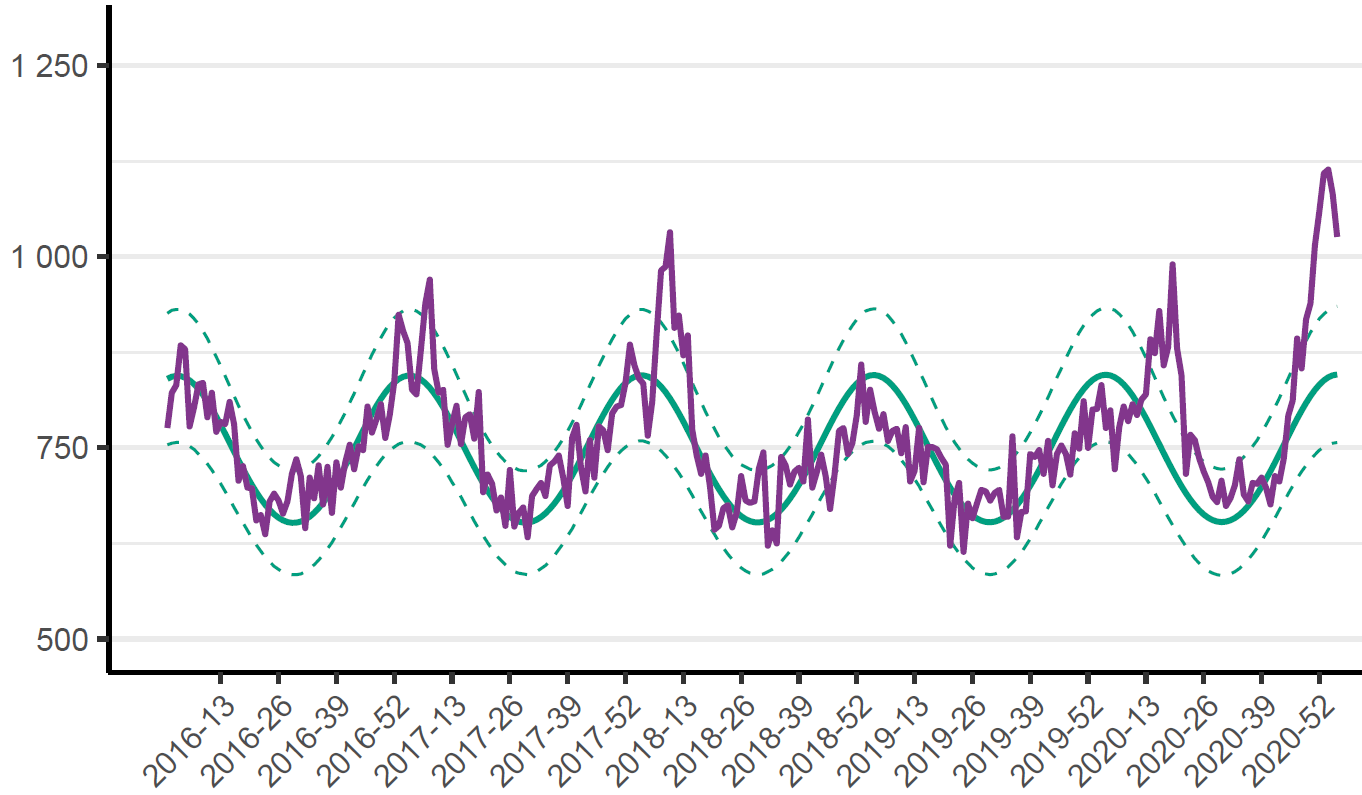
Fig. 8 As Figure 6 but for South Sweden (Jönköping, Kronoberg, Kalmar, Gotland, Blekinge, Skåne, Halland, Västra Götaland)
The population of South Sweden is dominated by that of Västra Götaland in the north west and Skåne in the south, which contain respectively Sweden’s second and third largest cities (Gothenburg and Malmö). In southernmost Sweden, the first wave barely breached the upper bound of the 95% confidence interval for normal deaths, while peak excess deaths in the second wave were three times that level (Figure 9). In the remainder of South Sweden, excess deaths in the second peaked at a broadly similar level to in the first wave. The same is true for North Sweden, which is relatively sparsely populated and has few sizeable cities.
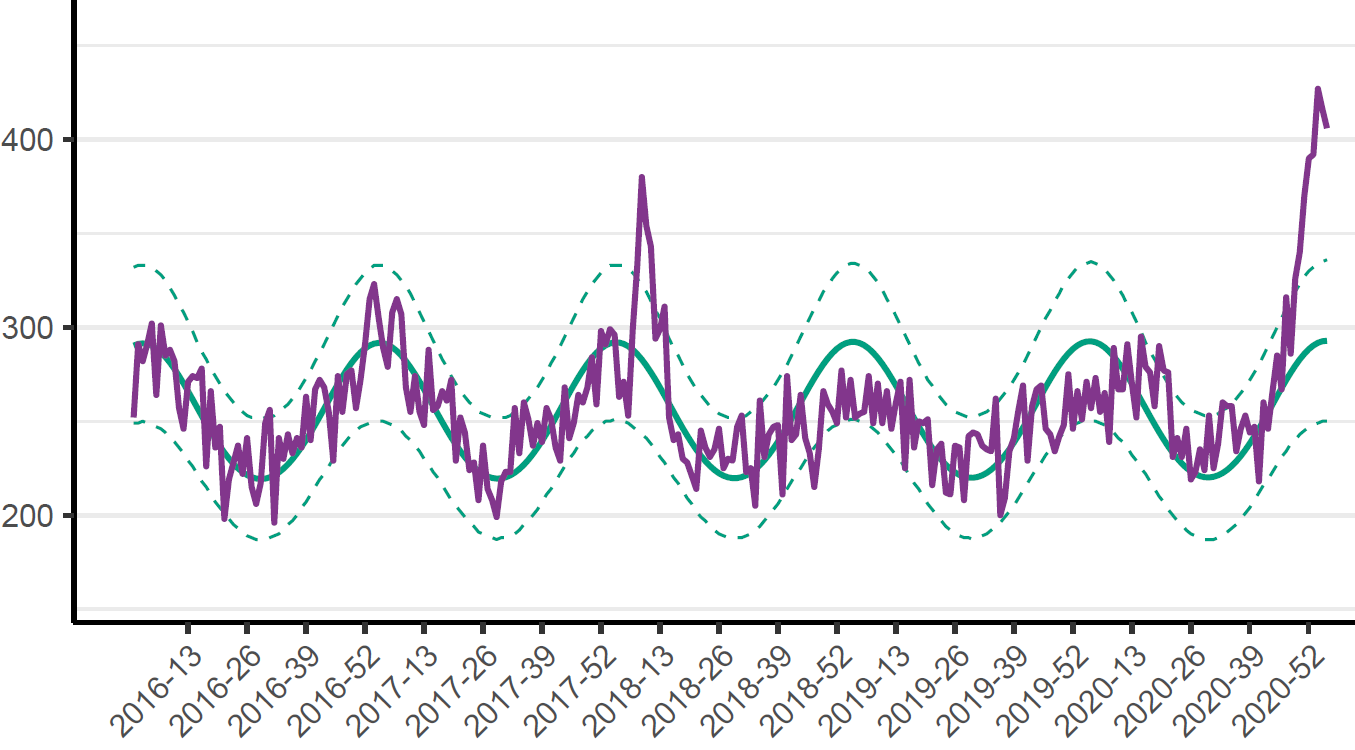
Fig. 9 As Figure 8 but for southernmost Sweden (Blekinge, Skåne) alone
In my view, the pattern of excess deaths in waves one and two in Stockholm-dominated East Sweden, compared to that in other parts of Sweden, suggests that much of the pool of people in East Sweden vulnerable to dying from COVID-19 had already succumbed by the end of wave one. On the other hand, although the level of previous infections and hence population immunity in Stockholm region at the end of wave one was more than adequate to inhibit large scale spread of COVID-19 during the summer, at the level of population mixing occurring then, with hindsight it was at that stage clearly insufficient to provide herd immunity in the winter, when transmission is higher, causing both the virus’s reproduction number (R0) and the herd immunity threshold to rise.[5]
Although it is too early to be certain, at present it appears that population immunity in both Stockholm region and Sweden as a whole is now adequate to prevent large-scale COVID-19 epidemic growth even in winter, at least at the current level of population mixing. However, there is a caveat in that the B.1.1.77 (UK-discovered) variant, which is estimated to be about one-third more transmissible[6] – and hence faster growing – only became apparent in Sweden during December. While present in 35% of all Swedish sequenced genomes during the first three weeks of 2021, it is not yet dominant, so transmission can be expected to rise as it achieves dominance over the next two or three months.
Total Swedish deaths due to COVID-19
Sweden had 10,082 deaths with confirmed COVID-19 infection for the 53 reporting weeks of 2020, ending 3 January 2021, including those reported subsequently.[7] On another measure[8], there were 9,432 deaths. Only 0.9% of deaths were of people under 50 years old, and only 3% were of under 60 year olds. People over 70 years old accounted for over 91% of COVID-19 deaths.
The definition of COVID-19 deaths imposed by the WHO is likely to over count deaths caused by COVID-19, since where there are multiple causes contributing to a death clinically-compatible with COVID-19 (normally respiratory failure or acute respiratory distress syndrome) it will be recorded as a death due to COVID-19 where SARS-CoV-2 infection is confirmed or suspected, even if COVID-19 is not considered to be the main cause of death.[9] Moreover, some countries have adopted even more over-pessimistic definitions of COVID-19 deaths. Others have likely undercounted COVID-19 deaths. And in many countries some deaths caused by COVID-19 at the start of the epidemic were probably not recognised as being such. Therefore, excess mortality over a normal level is usually thought to be the best measure of deaths due to COVID-19.
Excess mortality is primarily affected by the severity of respiratory disease (mainly influenza) winter seasons. A severe flu season, which may be caused by a new influenza virus strain, results in many more very frail unhealthy old people dying than a mild flu season. Severe flu seasons may occur in pairs in adjoining years, for instance due to widespread vulnerability to a new strain.
It follows that, other things being equal, fewer deaths will tend to occur in a flu season that follows a severe flu season, even more so where that is the second of a pair of severe flu seasons, as there will be fewer than normal very old and frail people alive. Correspondingly, more deaths than usual will tend to occur in a season following one or more mild flu seasons. This is known as the “dry tinder” effect. It has been shown, for example, that across 32 European countries there is a significant negative correlation (–0.63) between flu intensity in winter 2018/19 and 2019/20 combined and the COVID-19 mortality rate in the first wave (Figure 10).[10]
Sweden had unusually low mortality in 2019, which is largely a reflection of mild late 2018/19 and early 2019/20 flu seasons (the early and late part of each flu season falling in different calendar years). It thus had higher than usual “dry tinder” when the COVID-19 epidemic started.
A detailed analysis by a Danish researcher of the influence of “dry tinder” in Sweden, published by a US economic research institute, concluded that it accounted for many COVID-19 deaths.[11]
Similarly, an analysis by an economics researcher at a US university[12], which looked at 15 factors apart from severity of government interventions that might explain the higher COVID-19 deaths in Sweden than in other Nordic countries, concluded that the “dry tinder” factor was the most significant one. That paper also considered it plausible that Sweden’s lighter government interventions accounted for only a small part of Sweden’s higher Covid death rate than in other Nordic countries.
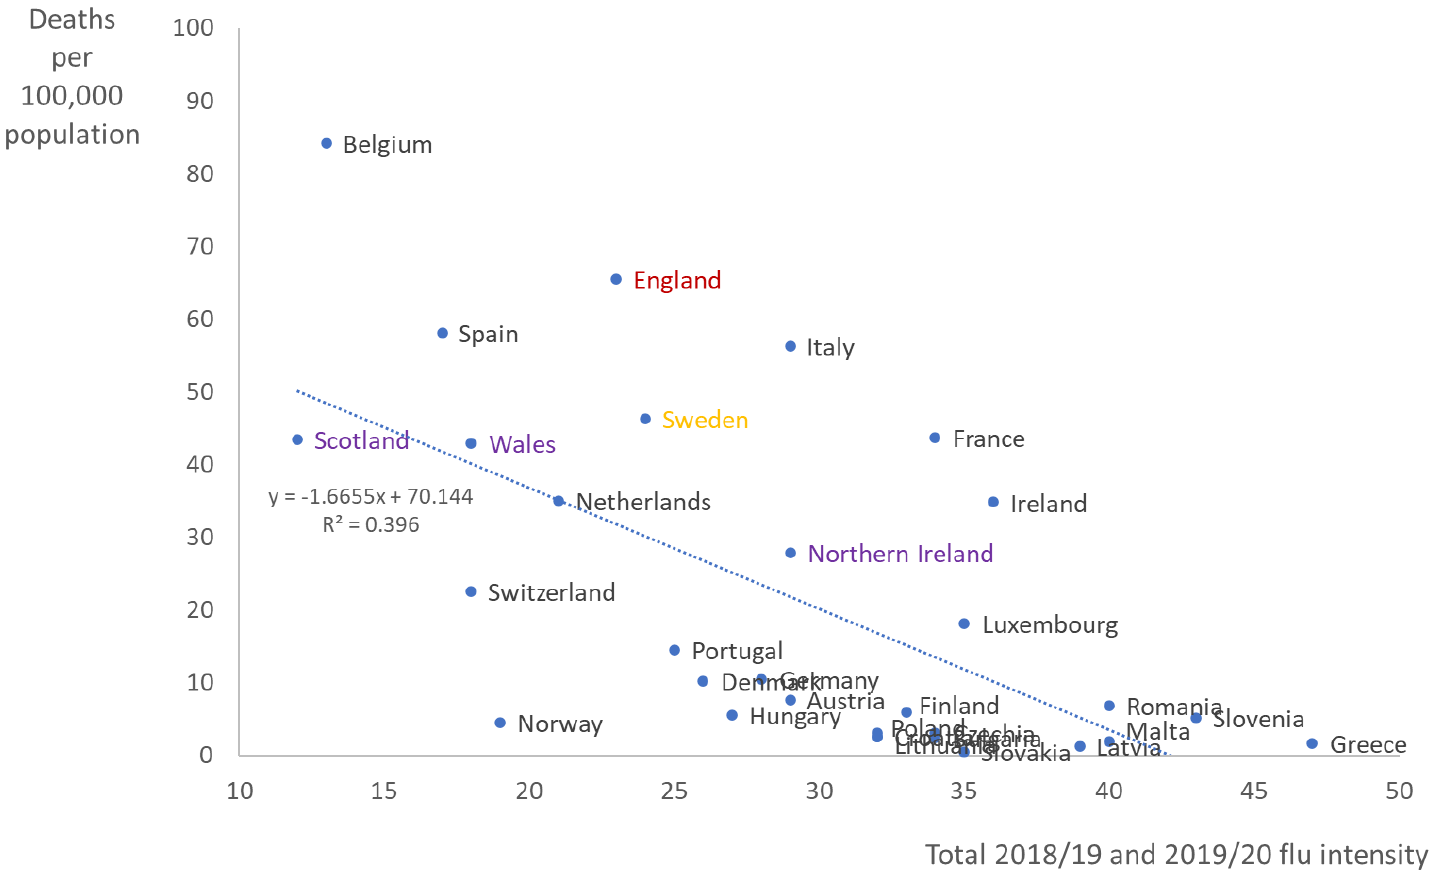
Fig.10 Death rate from COVID-19 up to 10 June 2020 by total 2-year flu intensity for 32 countries. The R2 of 0.396 (r=−0.63) is significant at the 1% level. A reproduction of Figure 1 in reference 10.
A fair estimate of excess deaths in Sweden caused by COVID-19 in 2020 should reflect the unusually large number of very old and frail people who survived 2019. That can be done by comparing actual and predicted deaths for 2019 and 2020 combined.[13]
I calculated excess mortality in Sweden for each year from 2000 on, by 5-year age group and sex, as the difference between actual mortality and normal mortality predicted by a regression fit to actual mortality rates over either 2000–2018 or 2009–2018, and then used population data to derive the expected number of deaths in a normal year for 2019 and 2020.[14] Mortality rates have been declining since 2000 in all age groups, although more slowly over the last decade. However, the effect on overall mortality of declining mortality rates at each age is partially counteracted by the increasing average age of the population.
When estimating normal mortality from trends in mortality over ,alternatively, 2000–2018 or 2009–2018, the excess combined 2019 and 2020 deaths were respectively 4,500 or 2,100, representing 0.043% or 0.020% of the mid-2020 Swedish population. For 2020 on its own, calculated excess deaths are 6,900 or 5,600 for the two regression bases (0.066% or 0.054% of the mid-2020 Swedish population).
Excess deaths for 2019 and 2020 combined were largely of men aged 65–79 and (to a lesser extent) aged 80–89 and 90+. Excess deaths of women were under 30% of those of men, based on mortality predicted by regressing over 2000-2018, and were actually negative based on regressing mortality over 2009-2018. On both regression bases and for both sexes, 2019 plus 2020 deaths of under 65 year olds were lower than predicted. And average overall mortality for 2019 and 2020 combined was lower than for any previous year this century (and very probably ever).
A more detailed analysis of Swedish mortality in 2020, but which used incomplete deaths data, was published a month ago by the blogger swdevperestroika; it is well worth reading.[15] That article made similar points, and reached similar conclusions, to my own analysis.
Comparison of Swedish and English excess deaths
I applied a similar analysis method to derive excess deaths in England for 2019 and 2020. The data published in England are rather less satisfactory than in Sweden, so the derived estimates should be regarded as approximate. I used data from Table 1 of the UK Office of National Statistics (ONS) monthly mortality analysis for December 2020, which spans 2001 to 2020.[16] Doing so gives best estimates for combined 2019 and 2020 excess deaths of 113,000 (0.20% of the population) when predicting normal deaths by regressing age-standardised annual mortality rates over 2001–2018, or 44,000 (0.08% of the population) when regressing over 2009–2018. The estimated excess deaths for 2020 alone were respectively 95,000 and 58,000. Other data published by the ONS suggests 2020 excess deaths in England were modestly below the average of these two estimates, and represented some 0.13% of the population.[17]
Conclusions
Whether the longer or shorter regression periods provide better estimates of normal mortality in 2019 and 2020, it seems clear that excess deaths, as a proportion of the population, were much higher in England than in Sweden. Excess deaths in England per 100,000 population were about four times those in Sweden for 2019 and 2020 combined, and about double those in Sweden for 2020 alone, .
Nicholas Lewis 18 February 2021
[1] The data is largely from daily Excel workbooks made available at https://www.folkhalsomyndigheten.se/smittskydd-beredskap/utbrott/aktuella-utbrott/covid-19/statistik-och-analyser/bekraftade-fall-i-sverige. I use versions published from 2 April 2020 (the earliest I could obtain) to 9 February 2021. During that period data ceased to be published at weekends and then also on Mondays. Data are presented as 7-day totals to a day of the week for which there is no missing cumulative dataset. Save for regional breakdowns of cases, I use the data as originally reported on each date, not the final adjusted daily figures (which do not provide the required breakdowns). There is a one day lag in reporting. Death numbers continue to be revised for up to several weeks due to reporting delays.
[2] “All pharmaceutical and non-pharmaceutical interventions are currently believed to have a stronger impact on transmission over space and time than any environmental driver.” Carlson CJ, Gomez AC, Bansal S, Ryan SJ. Misconceptions about weather and seasonality must not misguide COVID-19 response. Nature Communications. 2020 Aug 27;11(1):1-4. https://doi.org/10.1038/s41467-020-18150-z
[3] Engelbrecht FA, Scholes RJ. Test for Covid-19 seasonality and the risk of second waves. One Health. 2020 Nov 29:100202. https://doi.org/10.1016/j.onehlt.2020.100202
[4] https://www.folkhalsomyndigheten.se/contentassets/4b4dd8c7e15d48d2be744248794d1438/rapport-overdodlighet-vecka-3.pdf
[5] https://nicholaslewis.org/covid-19-why-did-a-second-wave-occur-in-regions-hit-hard-by-the-first-wave/
[6] https://assets.publishing.service.gov.uk/government/uploads/system/uploads/attachment_data/file/959426/Variant_of_Concern_VOC_202012_01_Technical_Briefing_5.pdf
[7] https://www.arcgis.com/sharing/rest/content/items/b5e7488e117749c19881cce45db13f7e/data. Downloaded 12 February 2020; available via link Ladda ner data from copy of https://www.folkhalsomyndigheten.se/smittskydd-beredskap/utbrott/aktuella-utbrott/covid-19/statistik-och-analyser/bekraftade-fall-i-sverige saved at www.webarchive.org
[8] https://www.socialstyrelsen.se/globalassets/1-globalt/covid-19-statistik/statistik-over-antal-avlidna-i-covid-19/statistik-covid19-avlidna.xlsx
[9] International guidelines for certification and classification (coding) of COVID-19 as cause of death. World Health Organization 20 April 2020
[10] Hope, C. COVID-19 death rate is higher in European countries with a low flu intensity since 2018. Cambridge Judge Business School Working Paper No. 03/2020, September 2020.
[11] https://www.aier.org/article/swedens-dry-tinder-accounts-for-many-covid-19-deaths/
[12] Klein, DB. 16 Possible Factors for Sweden’s High Covid Death Rate among the Nordics. George Mason University, Department of Economics Working Paper No. 20-27, August 2020. https://papers.ssrn.com/sol3/papers.cfm?abstract_id=3674138
[13] The 2020 death data, stratified by broad age bands, is currently available for reporting week numbers 1 to 53, plus some unallocated deaths. Since weeks 1 and 53 extend into respectively 2019 and 2021, I estimated deaths for the 2020 calendar year by deducting (53 * 7 – 362.25) times the average number of daily deaths in weeks 1 and 53 combined. I also adjusted up the actual 2019 deaths by 365.25/365 to give those for an average length year, which is what the regression fit estimate will be for.
[14] I undertook linear ordinary least squares regression of log(mortality), since mortality is more likely to improve by a certain fraction each year rather than by a fixed absolute amount. Results are almost identical if absolute mortality is regressed instead. Regressing over a longer the period reduces the influence of fluctuating flu intensity, but is less reflective of any change over time in the rate of improvement in mortality. Regressing over a shorter, ten year, period (2009–18) estimates a slightly slower fall in mortality over time than regressing over 2000–18. I downloaded annual mortality data for the whole of Sweden by sex and 5-year age bands on deaths generated at https://www.statistikdatabasen.scb.se/pxweb/sv/ssd/START__BE__BE0101__BE0101I/DodaHandelseK/. Likewise end 1999 to 2019 population data by sex and 1-year age bands from https://www.statistikdatabasen.scb.se/pxweb/en/ssd/START__BE__BE0101__BE0101A/BefolkningNy/. 2020 population estimates were taken from https://www.scb.se/en/finding-statistics/statistics-by-subject-area/population/population-composition/population-statistics/pong/tables-and-graphs/monthly-statistics–the-whole-country/preliminary-population-statistics-2020/. Deaths in 2020 were downloaded from https://scb.se/hitta-statistik/statistik-efter-amne/befolkning/befolkningens-sammansattning/befolkningsstatistik/pong/tabell-och-diagram/preliminar-statistik-over-doda/ on 8 February 2021.
[15] https://softwaredevelopmentperestroika.wordpress.com/2021/01/15/final-report-on-swedish-mortality-2020-anno-covid/
[16] https://www.ons.gov.uk/peoplepopulationandcommunity/birthsdeathsandmarriages/deaths/datasets/monthlymortalityanalysisenglandandwales
[17] The ONS has published provisional estimates of 2020 weekly excess deaths for 2020, but the data for the final two weeks appear to be incomplete. A crude adjustment for incompleteness implies that there were approaching 75,000 total excess deaths in 2020. That is in line with the ONS figure for recorded COVID-19 deaths in 2020. Public Health England estimates that there were approximately 70,000 excess deaths in 2020 from when COVID-19 deaths started occurring: https://fingertips.phe.org.uk/static-reports/mortality-surveillance/excess-mortality-in-england-week-ending-01-Jan-2021.html
Great article Nicholas! My understanding is that the excess deaths, which you’ve provided such excellent analysis on here, may be caused by both the disease itself, and also by the lockdowns. The latter might be because, among other things, people either don’t seek or are denied proper care for heart disease and cancer and so on. Is there any way to know how large these effects are separately, and what proportion of excess deaths are due to the disease itself vs the pandemic inspired response to it? Thanks again as always!
Christopher
I agree with you. Even general social distancing, including restrictions on freely mixing with friends and family, short of lockdown are likely to have negative effects of people’s mental and physical health, quite possibly including their ability to fight infections and other health problems. However, I’m afraid this isn’t an area I have much relevant expertise in.
Sadly, many of the likely negative side effects of lockdowns etc. will likely prove difficult to attribute to their cause, not least because they will often arise in the future, as with increased cancer and heart disease and deaths.
This paper doi.org/10.1136/bmjopen-2020-043828 estimates effects on cancer deaths, but only over a 1 year period. If you do a web search, you will find others.
Thank you Nic for another interesting analysis and insight. As you and others have pointed out, excess deaths requires a definition of what ‘normal’ deaths are for a given period. Using your age and population corrected excess deaths gives very different figures from the often quoted ‘excess relative to mean of last 5 years’. This lack of standardisation makes comparisons difficult and different definitions can and are being used to support the various narratives surrounding Covid.
The comparison with Sweden is fascinating; on either of the time reference periods used, England does not fare well. Whilst the two countries had different responses to Covid, there may also be significant differences in the health of each age cohort between countries. For example, there appears to be a strong correlation between BMI and severe illness, especially to Covid infection. To that end, I wonder if using something like metabolic age (which effectively derived BMI and chronological age) might give a more realistic comparison? Obviously, this would require some indication of BMI for each age cohort in government data.
One final query. The UK has made much of its vaccination program and its effect on Covid cases / deaths. Other European countries have not apparently, vaccinated as large a proportion of their populations. It is curious, therefore, that the case and death rates seem to be following much the same pattern in the UK as the rest of Europe. Might this suggest that seasonality is the prime driver of the data rather than vaccinations?
Kevin, sorry for the delay in responding. Using a crude 5-year average of past deaths as a proxy for normal deaths is clearly unsatisfactory. Even worse is the measure now being used by Public Health England to estimate Covid deaths; they comapre current deaths with those in three recent years with particularly mild flu seasons!
Good point about BMI/obesity being worse in the UK than Sweden. I’m not aware that metabolic age data is oublished for the population in either country, unfortunately.
Seasonality certainly appears to be a strong driver of transmission, and may well also affect death risk given infection. But vaccination takes over a month before it is reflected in reduced deaths. Deaths do seem to be dropping quite fast in the UK now. And probably an increasing proportion of those recorded as Covid deaths aren’t really caused by Covid, so won’t be reduced by vaccination.