A pdf copy of this article is available here
Key points
- A new variant, B.1.1.7, of the SARS-CoV-2 virus has recently spread rapidly in England
- The public health agency’s best estimate of B.1.1.7’s weekly growth rate advantage is 1.51x
- They mis-convert this in a reproduction number ratio of 1.47; converting appropriately gives 1.25
- Confident claims by the UK government scientific advisers that the higher growth of B.1.1.7 is due to increased transmissibility are misplaced; it could be partly of wholly due to other factors
- 1.1.7 has not shown a greater growth rate advantage than two previous variants did, both of which are now thought to have no greater transmissibility than previously existing variants
- There is little evidence that B.1.1.7 is more virulent, or likely to be resistant to existing vaccines
Introduction
The apparent rapid growth in England of a new variant of the SARS-CoV-2 virus that causes COVID-19 has led to dire warnings by those advising the UK government. Their advice suggested only that the new variant was more transmissible (more infective), not that it was more virulent (causes more serious illness). Nevertheless, it resulted in swift (many would say panicky) actions first by the UK government and then by governments of many other countries. The UK government imposed further restrictions on people’s freedom to mix and to move, while other countries banned travellers from the UK. Many millions of people in the UK had to cancel their plans for the Christmas holiday at very short notice, in addition to having their freedoms further curtailed thereafter. In this article I examine to what extent the advice that led to these damaging government actions was justified.
The new strain, B.1.1.7, and its spread in the UK
The UK government agency Public Health England (PHE) termed the new variant VUI-202012/01, and now VUC-202012/01, but I shall refer to it by the scientific name given to its lineage, B.1.1.7 (Rambaut et al.)[1], or just as “the new variant”. The lineage involves 8 amino acid changes (6 mutations and 2 deletions)[2] in the gene for the important spike protein, along with 9 amino acid changes[3] in genes for other proteins. The lineage has sometimes been referred to just by the name of the best known mutation it possesses, N501Y, but doing so is to be avoided as there are other variants that also have this mutation.
Rambaut et al. have this to say about the new lineage:
The B.1.1.7 lineage carries a larger than usual number of virus genetic changes. The accrual of 14 lineage-specific amino acid replacements prior to its detection is, to date, unprecedented in the global virus genomic data for the COVID-19 pandemic.
They also identify three of the mutations in particular (including N501Y) as being suspected of having potential biological effects.
B.1.1.7 was first detected in SARS-CoV-2 sequenced from a sample collected in south-east England on 20 September 2020, since when the cluster of cases has grown rapidly and spread to other locations. The UK sequences many more SARS-CoV-2 genomes than any other nation, and more than the rest of Europe combined, so the fact that B.1.17 was first detected in the UK does not necessarily imply that it originated there. The lineage has also been detected in several other countries and may well now be widespread.
Growth of the B.1.1.7 lineage in the UK can be tracked in sequencing data uploaded to GISAID. I used the COVID-CG processing facility[4] to select each day’s sequences with all eight B1.1.7 spike gene mutations.[5] As the daily data were noisy and few sequences were dated after 12 December 2020, I took 7-day moving averages, centred up to 9 December. Figure 1 shows the resulting proportion of all UK sequences represented by the B.1.1.7 lineage since its first emergence. It should be noted that the proportion of non-B.1.1.7 sequences represented by the areas in which B.1.1.7 first grew to prominence may have increased over time, resulting in the growth shown overstating how fast it grew in individual areas or in the UK as a whole.
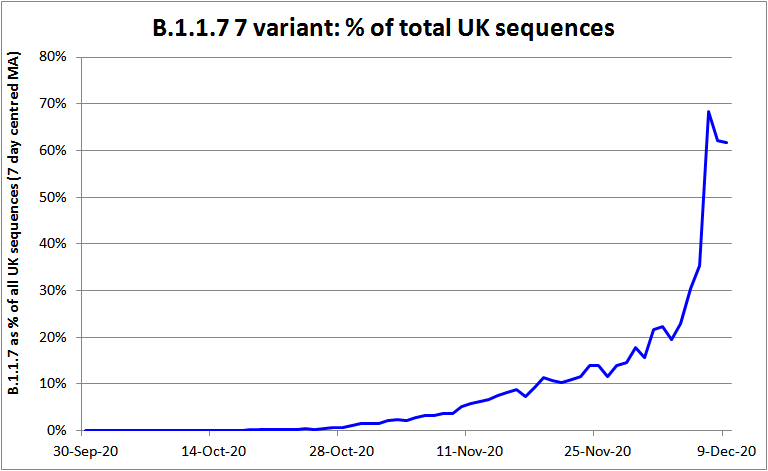
Figure 1. The proportion of all SARS-CoV-2 genomes sequenced in the UK made up by the B.1.1.7 lineage
The higher growth rate of B.1.1.7
A PHE report published on 21 December 2020[6] presents epidemiological evidence about the growth rate of B.1.1.7 relative to non-B.1.1.7 lineages. By using a proxy marker for B.1.1.7[7] they were able to utilise data from a significant proportion of the UK ‘pillar 2’ testing programme. Doing so provided a much larger dataset than that of sequenced SARS-CoV-2 genomes, and enabled stratification of weekly data for each of 42 NHS “STP” areas. Figure 2 reproduces Figure 1 of the PHE document, which shows the multiplicative advantage in weekly growth rates of B.1.1.7 cases (the ratio of B.1.1.7 to non-B.1.1.7 week t+1 cases divided by week t cases). The x-axis is for the B.1.1.7 proxy, S gene test negative. The week stated is the base week, so the yellow points reflect ratios of week 49 (week ending 5 December) cases to week 48 cases.
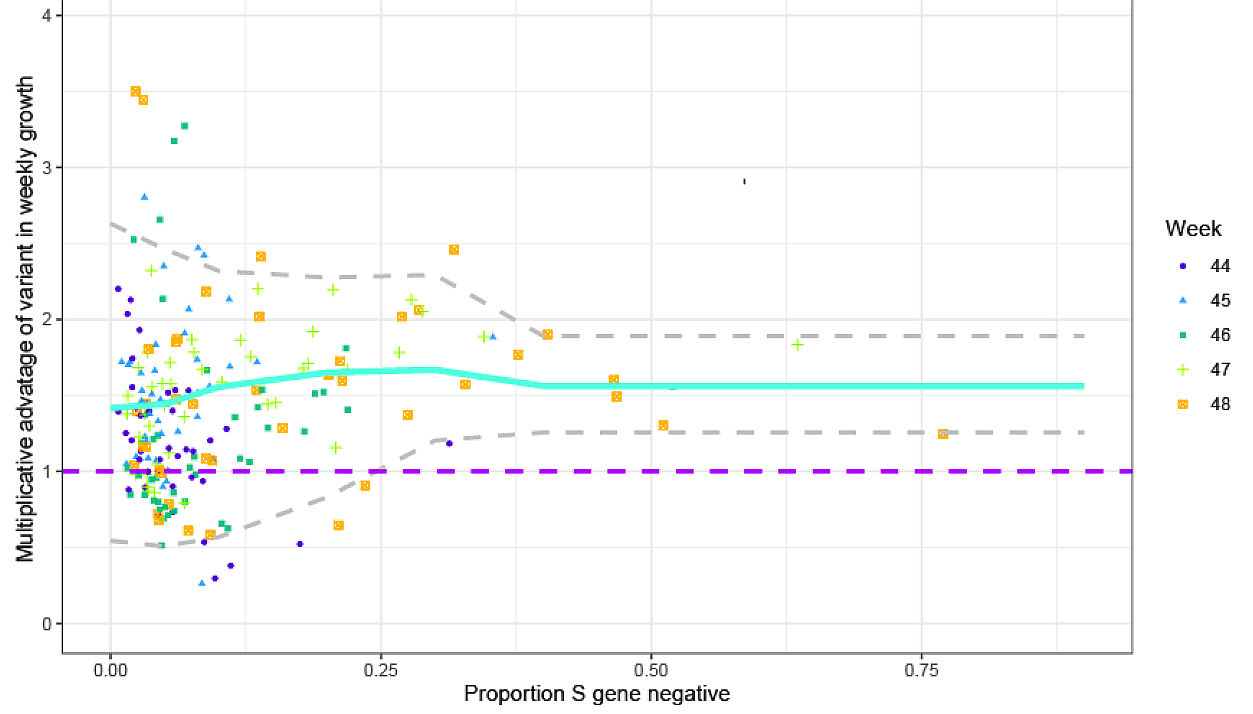
Figure 2. Empirical data analysis of the multiplicative advantage in weekly growth rates. Each point represents the ratio of weekly growth rates between B.1.17 [VOC] and non-B.1.1.7 for an NHS England STP area and week, based on the pillar 2 data shown in Figure S1 of the PHE report. Colours and shapes differentiate calendar weeks. Numbers above 1 show a multiplicative advantage. The blue line represents the mean value for a particular frequency, and the grey lines the 95% envelope. Scatter at low frequencies largely reflects statistical noise due to low counts.
When the new variant represents a small proportion of total cases (under ~ 25%, say), the proxy used is less satisfactory, and there is also a lot of scatter. Nevertheless, the variant’s proxy-based mean multiplicative advantage (ratio) in weekly growth is remarkably independent of its relative prevalence. That supports PHE’s methodology, although the week 48 data suggests that the multiplicative advantage might decline once the variant makes up more than ~25% of the total cases. PHE compute from this data a mean multiplicative advantage in weekly growth of 1.51 for B.1.1.7. By assuming a fixed generation interval of 6.5 days, they convert this into a reproduction number (Rt) multiplicative advantage of 1.47 for B.1.1.7 relative to other variants,.
PHE also estimated the effect of B.1.1.7 on Rt using genomic (sequencing) data for the same areas and weeks. They estimated an additive effect on Rt of 0.57, or 0.74 when the effect was allowed to vary between areas. PHE also estimated the effect on Rt using the PCR test S gene proxy data, adjusted for specificity (which is poor when the S gene negative proportion is low). Their estimates of the additive effect on Rt using that data were 0.52, or 0.60 when the effect was allowed to vary between areas. Using a Bayesian regression model their estimate of the effect was 0.56. However, since any biological difference in infectivity would be expected to cause a multiplicative effect on Rt, and Rt was varying during the analysis period, an estimated additive effect on Rt is less useful and also liable to be less accurate than a multiplicative estimate. In addition all these estimates involve more complicated statistical models, further assumptions and estimates of other variables. I therefore prefer their estimated multiplicative advantage of 1.51 (for weekly growth, prior to conversion to Rt scale), which is directly derived from underlying data. This is equivalent to a logarithmic daily growth rate advantage of 0.059.
Other evidence regarding the faster growth of B.1.1.7
A meeting of the NERVTAG[8] committee – which advises the government on the threat posed by new and emerging respiratory viruses – on the new variant took place on the 18 December 2020. The minutes[9] refer to an estimate from genomic data of a growth rate 71% higher than other variants; none of the documents that was considered by the committee contained such an estimate. It appears from the minutes of a subsequent meeting on 21 December 2020[10] that this was one of several undocumented estimates from NERVTAG member Professor Neil Ferguson of Imperial College. An alternative regression estimate that he apparently presented indicated that lineage B.1.1.7 had a Rt 0.39 higher than non-variant lineages from early November to early December. This is presumably an additive effect estimate, and is noticeably lower than PHE’s estimates using much the same method. Two other estimates stated in the minutes to be from Professor Ferguson both appear to actually be slightly misstated versions of the PHE estimate of a multiplicative Rt advantage of 1.47 for B.1.1.7.
The minutes of a further NERVTAG meeting the 21 December also mention a London School of Hygiene and Tropical Medicine estimate that B.1.1.7 was 56% more transmissible (a multiplicative advantage of 1.56 in Rt value). This estimate is documented in a preprint (Davies et al.[11]). The authors use a Subjective Bayesian method to fit a highly complex model with many probabilistic parameters, some fixed and others estimated. This is a far from robust, and quite possibly inherently biased, method of estimating the relative transmission rate. Moreover, they appear to use less informative data, broken down geographically only by the 7 NHS regions, not (as PHE used) by the 42 NHS STP areas. The use of less informative data implies that, even if they had employed a robust method, their estimates would be expected to be inherently less reliable than the PHE estimate. The uncertainty ranges of their estimates – which include a 99%+ confidence interval of 1.49x to 1.57x for the South East[12] region – appear to be quite unrealistically narrow, given the substantial uncertainties that exist. That casts further doubt on the realism of their estimates.
Finally, the NERVTAG 21 December meeting also considered a University of Edinburgh (Andrew Rambaut) phylogenetic estimate based on genetic sequences from Kent and London, that Rt was 1.57 or 1.72 depending on the time window used. Since no comparative Rt estimate for non-B.1.1.7 variants is mentioned in the meeting minutes, it is not possible to infer from this an estimate of the relative transmission rate of the new variant.
I conclude that the other evidence considered by NERVTAG is less robust and less useful than the PHE estimate of a multiplicative advantage in weekly growth of 1.51.
Why the faster growth of B.1.1.7 need not be due to increased transmissibility
While the evidence that the B.1.1.7 lineage has grown faster than other lineages in England over the two months or so to early/mid-December seems robust, one cannot infer biological properties of a virus from limited epidemiological data only. The apparent rapid spread of this new variant might be due to founder effects and super-spreader events rather than, or in addition to, increased transmissibility (higher infectivity).
It is instructive in this regard to consider two other lineages/variants that also had a period of exceptionally fast growth and, in one case, came to be totally dominant in most countries.
The G clade: spike gene mutation D614G
The D614G mutation arose early in the epidemic, emerging in Europe in February, and the G614 variant undoubtedly spread faster in most locations than D614. In very many countries, areas and cities it went from representing a minority of infections to being the dominant variant within a period of month or so. Since July 2020 it has accounted for approaching 100% of new infections in most countries and in all continents.
In the light of D614G becoming and remaining so dominant, it is unsurprising that a paper in August (Korber et al.[13]) argued that the D614G mutation increases transmissibility, citing several pieces of evidence:
- the consistency of increase [in frequency of G614] across geographic regions.
- the D614 form did not persist in many locations where the G614 form was introduced into the ongoing well-established D614 epidemics, as would be expected if the two forms were equally likely to propagate.
- the increase in G614 frequency often continued well after national stay-at-home orders [lockdowns] were in place, when serial reseeding from travellers was likely to be reduced significantly.
In addition to that epidemiological evidence, the authors also noted that increased transmissibility of G614 was consistent with other studies that suggested associations with increased infectivity in vitro[14] [15], and with their own finding of an association with higher viral loads in vivo. Moreover, another paper (Li, Q et al[16]) reported higher antigenicity for G614.
Most of Korber’s arguments are also fairly applicable to evidence suggesting that B.1.1.7 may be more transmissible. However, a more recent paper in Nature (van Dorp et al.[17]) found “no evidence for significantly more transmissible lineages of SARS-CoV-2 due to recurrent mutations”, including D614G (B.1.1.7 had not been identified by the end of the study period). This shows that, even after a new strain has become dominant, conclusions about its relative transmissibility drawn from epidemiological and indirect biological evidence may turn out to be wrong.
The 20A.EU1variant: spike mutation A222V
The 20A.EU1 variant, which involves spike gene mutation A222V, emerged in Spain in early summer 2020. It rapidly spread to other European countries, where it typically grew faster than non-20A.EU1 variants. Figure 3 plots the logarithmic daily growth rate of sequences with the A222V mutation in the UK, relative to those without it, over the two months to mid-September. Over that period the ratio of A222V to non-A222V new sequences grew from under 0.02 to 0.67. The mean logarithmic daily growth rate was 0.061 – a weekly multiplicative advantage of 1.53 – with essentially no trend. That multiplicative advantage is effectively identical to the 1.51 estimate by PHE for B.1.1.7 using data from mid-October to mid-December.
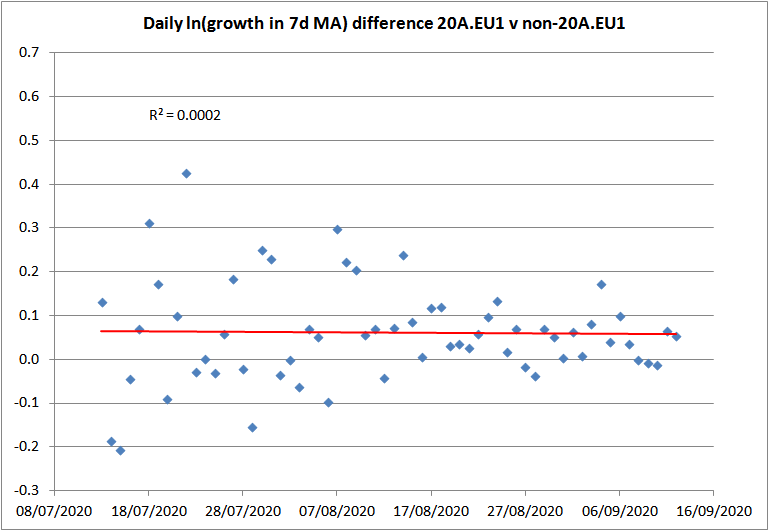
Figure 3. The logarithmic daily growth rate of the 7-day moving average of new sequences with the A222V mutation in the UK, relative to those without it, over the two months to 12 September 2020.
However, in the autumn the relative frequency of new A222V sequences stopped increasing in a number of countries, without – as D614G did – achieving total and continuous dominance (Figure 4). In the UK the A20.EU1 variant reached some 70% of all new sequences by the end of October, but it has since declined in relative frequency, as it has also done in Belgium, Germany and Switzerland.
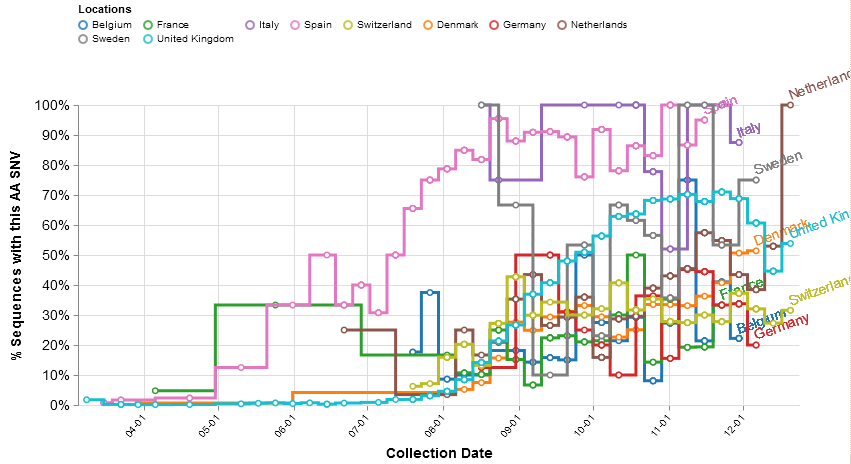
Figure 4. The proportion during 2020 of weekly new SARS-CoV-2 sequences in ten European countries that have the A222V mutation (implying they are the A20.EU1 variant)
Notwithstanding the rapid growth of the 20A.EU1 variant in many European countries during the summer and/or autumn, a November 2020 preprint paper about 20A.EU1 concluded: “We find no evidence of increased transmissibility of this variant, but instead demonstrate how rising incidence in Spain, resumption of travel across Europe, and lack of effective screening and containment may explain the variant’s success”.[18]
Overestimation of effect on Rt of possible increased transmissibility
Supposing that the higher growth rate to date of the B.1.1.7 lineage were all due to higher transmissibility, what effect would this have on the current reproduction number, Rt? That will depend on what Rt is and on the mean generation interval and its probability distribution. The longer the generation interval, the higher Rt required to produce a given growth rate. In the 21 December PHE publication, their estimate of the multiplicative advantage in weekly growth rate (of 1.51) is converted to a multiplicative advantage in Rt of 1.47 by assuming a fixed generation interval of 6.5 days: 1.47 = 1.51^(6.5/7).
However, PHE’s conversion formula is not justified, for two reasons:
- the generation interval is not fixed; and
- recent estimates of the mean generation interval are well below 6.5 days.
Most estimates of the generation interval (the period from one person being infected to them infecting another person) are in fact estimates of the serial interval (the period from the symptom onset in one person to symptom onset in a person they infect), since the time of infection is not observable. The generation interval can be validly estimated by combining probabilistic estimates of the serial interval and the incubation period (from infection to symptom onset). However, simply treating a probabilistic serial interval estimate as representing the generation interval distribution, as is typically done, is unsatisfactory.
PHE give no source for their assumption of a 6.5 days generation interval, but they could be following the Imperial College team, who used (in Flaxman et al.[19]) a generation interval with a 6.5 days mean, stating it was estimated by Bi et al.[20]. In fact, Bi et al. estimated the serial interval, not the generation interval, and fitted a gamma probability distribution with a mean of 6.3 days. However, their data included cases where the infecting individual did not isolate from others until long after symptom onset. Bi et al. found that if the infected individual was isolated less than three days after symptom onset, which would normally be the case in the UK now, the average serial interval was only 3.6 days.
Knight and Mishra (2020)[21] show that, to avoid overestimating the serial interval, it needs to be fitted to a probability distribution that, unlike the gamma distribution used by Bi et al., permits negative values (which are observed in a non-negligible proportion of cases). They consider a number of estimates examined in a review article of the incubation period and the serial interval, selecting the only serial interval estimate based on a negative-permitting probability distribution that had a large sample size (nearly ten times as large as that in Bi et al.), and the incubation period estimate that was based on the largest sample. Their resulting generation interval estimate has a mean of 3.99 days and a standard deviation of 2.96 days.[22]
Davies et al. say that their complex Bayesian model, which estimated a multiplicative advantage of 1.56 in Rt value using a fairly long generation interval, fitted less well when they used a shorter interval. However, it seems probable that the main reason they obtain a poor fit to the relative growth in the new variant during lockdown with a shorter generation interval is that their model greatly overestimates the effect of the November lockdown. [23]
Using the Knight and Mishra estimated distribution for the generation interval, and the correct conversion formula,[24] the PHE estimate of the B.1.1.7 lineage’s multiplicative advantage in weekly growth rate of 1.51 corresponds to a multiplicative advantage in Rt of 1.25.[25] That is only about half the multiplicative advantage of 1.47 estimated by PHE.[26] It implies that less extensive and severe measures would be required to prevent exponential growth of infections given the emergence of B.1.1.7 than is implied by the PHE estimate of a 1.47 multiplicative advantage in Rt, even if the observed multiplicative advantage in weekly growth rate of B.1.1.7 to mid-December is entirely caused by it being more transmissible.
The new South African variant
A new SARS-CoV-2 lineage that also involves a N501Y spike gene mutation, and a number of other mutations (differing from those in B.1.1.7), has recently emerged in South Africa, as described by Tegally et al.[27], who term it 501Y.V2. They say that genomic data, showing the rapid displacement of other lineages, suggest that this lineage may be associated with increased transmissibility. However, the limited evidence available so far is insufficient to justify the alarmist comments from the UK government health minister, that “This new variant is highly concerning because it is yet more transmissible and it appears to have mutated further than the new variant discovered in the UK”.[28] As a professor of molecular virology at the University of Nottingham stated, the mutation involved has been seen before, we have no idea whether it impacts on virus transmissibility, and we should avoid panicking at this point.[29]
Conclusions
The G clade and 20A.EU1 examples illustrate that apparently strong epidemiological evidence of a higher growth rate of a new variant over considerable period, even where it leads to apparently permanent dominance, and notwithstanding it being accompanied by evidence suggesting that the variant is associated with higher viral loads, does not enable a valid conclusion that the variant has higher transmissibility than existing variants. Such evidence may be suggestive of higher transmissibility, but it does not reliably demonstrate it.
Despite this, the NERVTAG committee concluded with moderate confidence on 18 December that the new variant “demonstrates a substantial increase in transmissibility compared to other variants” and at their 21 December meeting went further and expressed high confidence that “B.1.1.7 can spread faster than other SARS-CoV-2 virus variants currently circulating in the UK”. While admitting that the underlying cause of faster spread was unclear, the causative factors that they suggested related exclusively to higher transmissibility. It is not surprising, given that NERVTAG’s confident conclusions are not justified by the facts, that a number of experts in the UK and other countries have disputed them[30] or expressed contrary views,[31] [32] [33] Unsurprisingly, the mainstream media are reporting, incorrectly, that B.1.1.7 has been proven to possess substantially increased transmissibility.
I have argued that the estimate by PHE of a multiplicative weekly growth advantage of 1.51 for B.1.1.7 is, for several reasons, more robust and accurate than the other available estimates. I have shown that, even if the higher growth to date of B.1.1.7 were due entirely to increased transmissibility, it would correspond to a multiplicative advantage in Rt of only 1.25, half as high an advantage as calculated by PHE using an inappropriate conversion formula.
There is no evidence to date that B.1.1.7 is any more any virulent than existing strains, nor that it will be resistant to the vaccines that have been developed. Expert opinion appears to be that neither of these are likely to be the case.[34]
These findings imply that B.1.1.7 does not currently appear to represent a serious increase in the menace posed by SARS-CoV-2, even in the worst case that its higher observed growth rate is entirely due to increased transmissibility. In the best case, its higher growth rate will turn out not to spring to any extent from increased transmissibility, as now appears to be the case with the G clade and 20A.EU1 variant.
Accordingly, it is difficult to see that imposing drastic measures to slow transmission, further reducing economic activity, social activity and peoples freedom, are justified by the current evidence regarding the emerging B.1.1.7 lineage.
However, as further evidence becomes available it could strengthen, or weaken, the case that the emergence of B.1.1.7 represents a serious development. It is important that the UK authorities start to release, on a daily basis and at local authority area or finer level, all available data on cases of the new strain, as indicated by the ‘S gene negative’ proxy and any other method. At present they are keeping this information non-public, which makes it impossible for independent researchers properly to assess on a timely basis, and if necessary challenge, what may be mistaken conclusions. Moreover, it is highly desirable that no SARS-CoV-2 or COVID-19 related report or study should hereafter be considered by the government or its advisers unless it is accompanied by a link at which all the data used is available.
Nicholas Lewis 29 December 2020
[1] Rambaut, A et al: Preliminary genomic characterisation of an emergent SARS-CoV-2 lineage in the UK defined by a novel set of spike mutations. COVID-19 Genomics Consortium UK, ARTIC network 19 December 2020. https://virological.org/t/preliminary-genomic-characterisation-of-an-emergent-sars-cov-2-lineage-in-the-uk-defined-by-a-novel-set-of-spike-mutations/563
[2] N501Y, A570D, P681H, T716I, S982A and D1118H mutations plus HV69-70 and Y144 deletions
[3] T1001I, A1708D and I2230T mutations plus SGF3675-3677 deletion in the ORF1ab gene; R52I and Y73C mutations plus Q27stop codon in the Orf8 gene; D3L and S235F in the N gene. There are also 6 synonymous (non-amino acid changing) mutations: 5 in ORF1ab (C913T, C5986T, C14676T, C15279T, C16176T), and 1 in the M gene (T26801C).
[4] https://www.covidcg.org/?tab=location# . Data downloaded 26 December 2020.
[5] Only the total number of each day’s sequences with each mutation are available via COVID-CG, but the number of each of the eight spike mutations appearing each day (r >0.999, except 0.991for the HV69-70 deletion, which sometimes occurs in other strains), implying that they have an extremely high co-occurrence. I took the minimum number each day for the eight spike mutations as the count for B.1.1.7 sequences. Incorporating non-spike mutation data appears unnecessary; the match of all B.1.1.7 spike mutations with all ORF1ab B.1.1.7 mutations is almost perfect apart from A1708D, which seems absent in about 1% of cases where all 11 other spike and ORF1ab mutations are present.
[6] Public Health England: Investigation of novel SARS-COV-2 variant – Variant of Concern 202012/01. https://assets.publishing.service.gov.uk/government/uploads/system/uploads/attachment_data/file/947048/Technical_Briefing_VOC_SH_NJL2_SH2.pdf
[7] S gene negative, N and ORF1ab positive TaqPath PCR test result.
[8] NERVTAG: New and Emerging Respiratory Virus Threats Advisory Group
[9] NERVTAG COVID-19 VUI communication 18122020_final.pdf, available at https://app.box.com/s/3lkcbxepqixkg4mv640dpvvg978ixjtf/folder/111416414559
[10] NERVTAG COVID-19 VOC communication 21122020 final.pdf, available at https://app.box.com/s/3lkcbxepqixkg4mv640dpvvg978ixjtf/folder/111416414559
[11] Davies, NG et al: Estimated transmissibility and severity of novel SARS-CoV-2 Variant of Concern 202012/01 in England. Centre for Mathematical Modelling of Infectious Diseases, London School of Hygiene and Tropical Medicine, updated 23 December 2020. https://cmmid.github.io/topics/covid19/reports/uk-novel-variant/2020_12_23_Transmissibility_and_severity_of_VOC_202012_01_in_England.pdf
[12] Figure1A of Davies et al, rightmost panel.
[13] Korber, B. et al. Tracking changes in SARS-CoV-2 spike: evidence that D614G increases infectivity of the COVID-19 virus. Cell 182, 812.e19–827.e19 (2020). https://doi.org/10.1016/j.cell.2020.06.043, 20 August 2020
[14] Zhang, L. et al. The D614G mutation in the SARS-CoV-2 spike protein educes S1 shedding and increases infectivity. Preprint at https://doi.org/10.1101/2020.06.12.148726, 12 June 2020
[15] Yurkovetskiy, L. et al. Structural and functional analysis of the D614G SARSCoV-2 spike protein variant. Cell 183, 739.e8–751.e8 https://doi.org/10.1016/j.cell.2020.09.032, October 2020
[16] Li, Q. et al. The impact of mutations in SARS-CoV-2 spike on viral infectivity and antigenicity. Cell 182, 1284.e9–1294.e https://doi.org/10.1016/j.cell.2020.07.012, September 2020
[17] van Dorp, L et al., No evidence for increased transmissibility from recurrent mutations in SARS-CoV-2. Nature, November 2020. https://doi.org/10.1038/s41467-020-19818-2
[18]Hodcroft, BH et al: Emergence and spread of a SARS-CoV-2 variant through Europe in the summer of 2020. medRxiv 27 November 2020 https://doi.org/10.1101/2020.10.25.20219063
[19] Flaxman, S., Mishra, S., Gandy, A. et al. Estimating the effects of non-pharmaceutical interventions on COVID-19 in Europe. Nature 584, 257–261 (2020). https://doi.org/10.1038/s41586-020-2405-7
[20] Bi, Q. et al. Epidemiology and Transmission of COVID-19 in Shenzhen China: Analysis of 391 cases and 1,286 of their close contacts. medRxiv (2020) https://doi.org/10.1101/2020.03.03.20028423
[21] Knight, J. and Mishra, S.: Estimating effective reproduction number using generation time versus serial interval, with application to COVID-19 in the Greater Toronto Area, Canada. Infectious Disease Modelling 5 (2020) 889e896, November 2020. https://doi.org/10.1016/j.idm.2020.10.009
[22] Knight and Mishra fit their generation interval estimate using a gamma distribution. Unlike the serial interval, the generation interval cannot be negative so a gamma distribution is suitable here.
[23] They say that the poor fitting with a shorter generation interval was because it predicted that the new strain should have decreased in relative frequency during November’s lockdown. As they write: “When Rt < 1 for both variants, a shorter generation time is a selective disadvantage, because infections with this variant decline faster compared to a variant with the same Rt but transmitting on a longer timescale.” However, that is only true if Rt was below 1 during lockdown, whereas their Fig. 1E shows that, in reality, Rt remained at or marginally above 1 during lockdown. That is consistent with the mobility data in Davies et al. Fig.1C, which show little difference between immediately prior to the start and the end of lockdown. An overall Rt of 1 implies that the infections with the more transmissible variant will increase in relative frequency, as occurred, not decrease. Also, the complexity of their model means that the poor fitting could to be partially or wholly due to other causes, such as a long generation interval compensating for another parameter being misestimated, or to the peculiar way in which they represented a shortened generation interval.
[24] Wallinga, J., & Lipsitch, M. (2007). How generation intervals shape the relationship between growth rates and reproductive numbers. Proceedings of the Royal Society B: Biological Sciences, 274(1609), 599-604. https://doi.org/10.1098/rspb.2006.3754 Using their equation 2.9 in conjunction with the gamma distribution moment generating function.
[25] The estimate of the multiplicative advantage assumes that Rt for the other strains is 1.0; the inferred multiplicative advantage is a slowly decreasing function of Rt for the other strains.
[26] The same is approximately true throughout PHE’s 95% confidence interval of for the Rt ratio of 1.34–1.59, which when converted in the same way corresponds to an Rt ratio range of 1.19–1.30.
[27] Tegally, Houriiyah, et al. “Emergence and rapid spread of a new severe acute respiratory syndrome-related coronavirus 2 (SARS-CoV-2) lineage with multiple spike mutations in South Africa.” medRxiv 22 December 2020. https://doi.org/10.1101/2020.12.21.20248640
[28] As quoted in the Guardian, 23 December 2020. https://www.theguardian.com/world/2020/dec/23/south-african-covid-19-variant-has-reached-the-uk-says-matt-hancock
[29] Professor John Ball, as quoted at https://www.sciencemediacentre.org/expert-reaction-to-south-african-variant-of-sars-cov-2-as-mentioned-by-matt-hancock-at-the-downing-street-press-briefing/
[30] Vincent Racaniello, Professor of Immunology, Columbia University. Extensive detailed comments, including that “none of the isolates so far have proven implications for human transmission or pathogenesis, including the latest variant isolated from the UK.” and, concerning the NERVTAG 21 December meeting: “You can’t use epidemiological data to prove a biological effect of a amino acid change in a virus; you have to do experiments to do that. And that’s what they’re doing here. They say, there is an increase in the transmissibility. It must be because of the variant. Well, obviously that’s a flawed argument. That’s not how we do science.” https://www.virology.ws/2020/12/24/sars-cov-2-uk-variant-does-it-matter/ ; transcript at https://dryburgh.com/vincent-racaniello-coronavirus-variant-voc-202012-01/
[31] Dr Julian Tang, Honorary Associate Professor/Clinical Virologist, University of Leicester, said:
“The spread of this new virus variant could be due to many factors. As we saw with the earlier D614G variant – just higher viral loads in clinical diagnostic swabs or in cell culture may not necessarily translate to a more transmissible virus at the population level.
“A higher genomic growth rate in the samples sequenced, may not necessarily mean higher transmissibility, e.g. if there was a rave of several thousand people where this variant was introduced and infected many people mostly in that rave, this may seem very high compared to a lower background of non-variant virus, e.g. in an otherwise prevailing national lockdown.” https://www.sciencemediacentre.org/expert-reaction-to-brief-summary-of-nervtag-opinion-from-the-nervtag-meeting-on-sars-cov-2-variant-under-investigation-vui-202012-01/
[32] Professor Vineet Menachery, University of Texas Medical Branch, said: “So this isn’t the first time we’ve seen variants emerge quickly or begin to dominate the population of viruses that we’re seeing. And so I’m not particularly worried at this moment. There is evidence that it is maybe slightly more transmissible, but we’re not at this point knowing enough about it to really be scared in the sense that it’s a different order of magnitude, that it’s going to be a major threat moving forward.” https://health.wusf.usf.edu/npr-health/2020-12-21/new-coronavirus-variant-found-in-u-k-what-does-it-mean-for-the-world
[33] Dr Nusrat Homaira, Respiratory Epidemiologist, UNSW Sydney. “There is modest evidence suggesting that this new variant of Sars-CoV-2 is more transmissible, and is speculated to be the reason for the recent increase in the number of Covid-19 cases in London, South East, and East of England regions.” https://www.dhakatribune.com/opinion/op-ed/2020/12/24/the-new-variant-of-the-sars-cov-2-what-it-all-means
[34] Dr Julian Tang, Honorary Associate Professor/Clinical Virologist, University of Leicester, said: “We are not seeing any increased virulence (clinical severity) or any gross changes in the S (spike protein) that will reduce vaccine effectiveness – so far.” https://www.sciencemediacentre.org/expert-reaction-to-brief-summary-of-nervtag-opinion-from-the-nervtag-meeting-on-sars-cov-2-variant-under-investigation-vui-202012-01/
Great article as usual Nic. What do you make of this paper? https://www.medrxiv.org/content/10.1101/2020.12.24.20248834v1
Thanks for the link. I note that the preprint finds that a substantially larger proportion of B.1.1.7 cases have a high viral load, suggesting (although not proving) higher infectiveness for the new variant.
As more data and anslyses become available, it is looking rather more likely (although not certain) that B.1.1.7 really is significantly more infectious than previous strains. However, I remain of the view that at the time NERVTAG made their ‘high confidence’ finding, the available data and the analytical work that they cited did not justify their doing so.
Nic, curious on your POV as we now have more data on this?
Now we’ve got more data, it does look to me as if the B.1.1.7 variant is more infectious. I’ve recently seen the 30-50% more infectious range mentioned by scientists. I would say somewhere around the bottom end of that range is most likely. I think most scientists are ignoring my key argument that a lower mean value of the generation interval than they typically use, and allowing for its probabilistic dispersion, is appropriate. That results in the observed/estimated relative growth rate being explained by a lower relative infectivity than they calculate.
Got it, thanks!