A pdf copy of this article is available here
I showed in my May 10th article Why herd immunity to COVID-19 is reached much earlier than thought that inhomogeneity within a population in the susceptibility and in the social-connectivity related infectivity of individuals would reduce, in my view probably very substantially, the herd immunity threshold (HIT), beyond which an epidemic goes into retreat. I opined, based on my modelling, that the HIT probably lay somewhere between 7% and 24%, and that evidence from Stockholm County suggested it was around 17% there, and had been reached. Mounting evidence supports my reasoning.[1]
I particularly want to highlight an important paper published on July 24th “Herd immunity thresholds estimated from unfolding epidemics” (Aguas et al.).[2] The author team is much the same as that of the earlier theoretical paper (Gomes et al.[3]) that prompted my May 10th article.
Aguas et al. used a SEIR compartmental epidemic model modified to allow for inhomogeneity, similar to the model I used although they also considered further variants. They fitted their models to scaled daily new cases data from four European countries for which disaggregated regional case data was also readily available. In all cases they found a better fit from their models incorporating heterogeneity to the standard homogeneous assumption SEIR model. They found that:
Homogeneous models systematically fail to fit the maintenance of low numbers of cases after the relaxation of social distancing measures in many countries and regions.
Aguas et al. estimate the HIT at between 6% and 21% for the countries in their analysis – very much in line with the range I suggested in May. They also found that their HIT estimates were robust to various changes in their model specification. By contrast, if the population were homogeneous or were vaccinated randomly, the estimated HIT would have been around 65% –80%, in line with the classical formula, {1 – 1/R0}, where R0 is the epidemic’s basic reproduction number.[4]
Aguas et al.’s Figure 3, reproduced below, shows how the HIT reduces with increasing variation either in susceptibility (given exposure) or in connectivity, which affects both an individual’s susceptibility (via altering exposure to infection) and infectivity. The coloured dots and vertical lines show the inferred position of each of the four countries they analysed in each of these (separately modelled) cases.
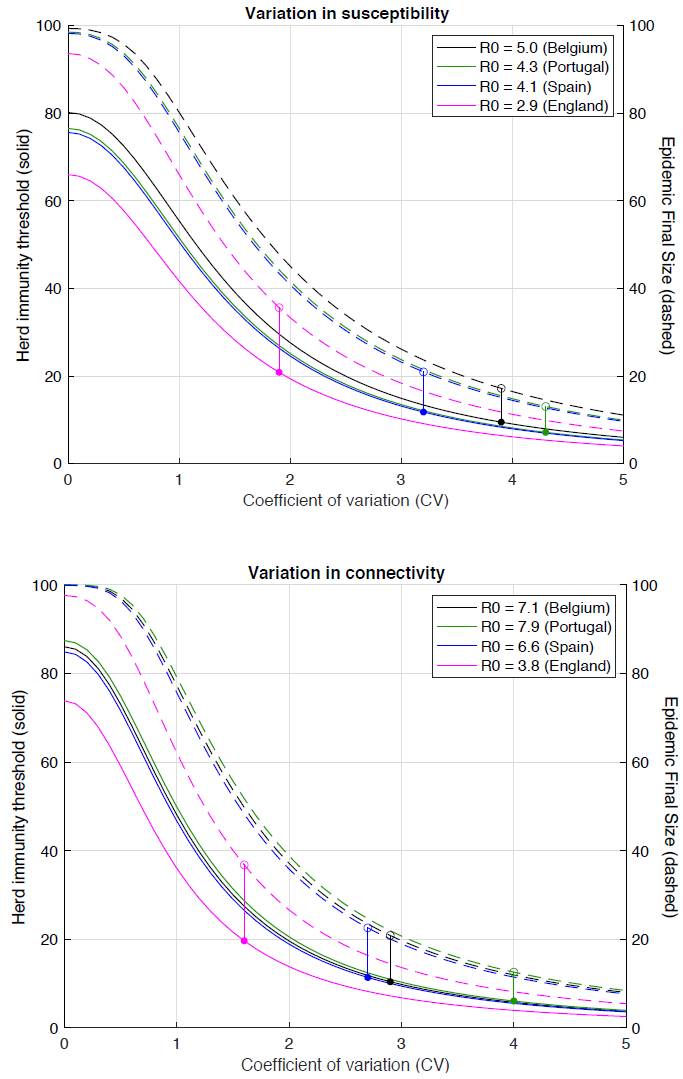
Aguas et al. Fig. 3 Herd immunity threshold with gamma-distributed susceptibility (top) or connectivity related exposure to infection (bottom). Curves generated with the SEIR model (Equation 1-4) assuming values of R0 estimated for the study countries assuming gamma-distributed: susceptibility [top]; connectivity (and hence exposure to infection) [bottom]. Herd immunity thresholds (solid curves) are calculated according to the formula 1 − (1/R0)1/(1 + CV^2) for heterogeneous susceptibility and 1 − (1/R0)1/(1 + 2 CV^2) for heterogeneous connectivity. Final sizes of the corresponding unmitigated epidemics are also shown (dashed).
As Aguas et al. say in their Abstract:
These findings have profound consequences for the governance of the current pandemic given that some populations may be close to achieving herd immunity despite being under more or less strict social distancing measures.
The underlying reason for the classical formula being inapplicable is, as they say:
More susceptible and more connected individuals have a higher propensity to be infected and thus are likely to become immune earlier. Due to this selective immunization by natural infection, heterogeneous populations require less infections to cross their herd immunity threshold than suggested by models that do not fully account for variation.
The Imperial College COVID-19 model (Ferguson et al.[5]) is a prime example of one that does not adequately account for variation in individual susceptibility and connectivity.
Aguas et al. point out that consideration of heterogeneity in the transmission of respiratory infections has traditionally focused on variation in exposure summarized into age-structured contact matrices. They showed that, besides this approach typically ignoring differences in susceptibility given virus exposure, the aggregation of individuals into age groups leads to much lower variability than that they found from fitting the data. The resulting models appeared to differ only moderately from homogeneous approximations.
A key reason for variability in susceptibility to COVID-19 given exposure to the SARS-CoV-2 virus causing is that the immune systems of a substantial proportion (35% to 80%) of unexposed individuals have T-cells, circulating antibodies or other components that are cross-reactive to SARS-CoV-2 and can be expected to provide substantial resistance to it.[6] [7] [8] [9] Such components likely arise from past exposure to common cold or other coronaviruses, or to influenza.[10] Not being specific to SARS-CoV-2, and typically not being antibodies, such immune system components are not normally detected in seroprevalence or other tests for immunity to SARS-CoV-2.
I will end with a follow up to my June 28th article focusing on Sweden. In it, I concluded that it was likely the HIT had been surpassed in the three largest Swedish regions, and in the country as a whole, by the end of April notwithstanding that COVID-19-specific antibodies had only been detected in 6.3% of the population.[11] I also projected, based on their declining trend, that total COVID-19 deaths would likely only be about 6,400. Subsequent developments support those conclusions. Swedish COVID-19 deaths have continued to decline, notwithstanding a return to more travel and less social distancing, and are now down to 10 to 15 a day. According to the latest Financial Times analysis,[12] excess mortality in Sweden over 2020 to date was 5,500, or 24%. That is only about half the excess mortality percentage for the UK (45%), Italy (44%) and Spain (56%), and is also lower than for France (31%), the Netherlands (27%) and Switzerland (26%), despite Sweden not having imposed a lockdown or shut primary schools. Moreover, total mortality in Sweden over the last 24 months is now lower than over the previous 24 months, despite an upward trend in the old age population.
Nicholas Lewis 27 July 2020
Further update 31 July 2020
Another important paper has now been published on the role of inhomogeneity within a population in the social-connectivity related susceptibility and infectivity of individuals and in biological susceptibility: “Persistent heterogeneity not short-term overdispersion determines herd immunity to COVID-19” (Tkachenko et al.)[13]. The paper’s mathematical/statistical analysis is excellent.[14] Their method of estimating the role of population inhomogeneity in lowering the herd immunity threshold seems reasonable in principle.[15]
However, they estimated the effect of inhomogeneity during lockdowns, and assumed that the effect is the same in other circumstances. But a key effect of social distancing measures, including public events bans, bar and restaurant closures, etc. as well as full lockdowns, is to heavily reduce the number of contacts by the most connected people that are capable of transmitting infection. For people with few social connections, such measures will have a proportionately much smaller effect. So the effect in more normal circumstances of population inhomogeneity in social-connectivity, which appears to be more important than inhomogeneity in biological susceptibility, is bound to be underestimated, quite possibly substantially, by their approach.
Nevertheless, their best fit to New York City COVID-19 data during lockdown gives an estimate of an inhomogeneity factor[16] λ of 4.5.[17] An alternative estimation method based on a cross-sectional regression across US States gives a λ estimate of 5.3.[18]
A middle of the range λ value of 4.9 implies a HIT of 20% if R0 = 3.0 (16.4% if R0 = 2.4; 24.6% if R0 = 4; 28.0% if R0 = 5). It also equates, if all the inhomogeneity is social-connectivity related, to a coefficient of variation (CV)[19] of 1.4 – which is the geometrical mean of the two CV values (1 and 2) that I used in my original article.
Estimating λ from fits to the NYC or Chicago data prior to lockdown implies much higher CV estimates, in the range 2.4 to 2.9 if all inhomogeneneity is social-connectivity related, in non-lockdown circumstances. The corresponding estimates for nine of the worst hit US States range from 1.9 to 3.4.[20]
[1] One example, further supporting my superspreader-based evidence of variability in social connectivity, is Miller et al: Full genome viral sequences inform patterns of SARS-CoV-2 spread into and within Israel medRxiv 22 May 2020 https://doi.org/10.1101/2020.05.21.20104521 This paper shows that 1-10% of infected individuals caused 80% of infections. That points to variability in social connectivity related susceptibility and infectivity quite likely being higher than I modelled .
[2] Aguas, R. and co-authors: Herd immunity thresholds estimated from unfolding epidemics” medRxiv 24 July 2020 https://doi.org/10.1101/2020.07.23.20160762
[3] Gomes, M. G. M., et al.: Individual variation in susceptibility or exposure to SARS-CoV-2 lowers the herd immunity threshold. medRxiv 2 May 2020. https://www.medrxiv.org/content/10.1101/2020.04.27.20081893v1
[4] The basic reproduction number of an epidemic, R0, measures how many people, on average, each infected individual infects at the start of the epidemic. If R0 exceeds one, the epidemic will grow, exponentially at first. But, assuming recovered individuals are immune, the pool of susceptible individuals shrinks over time and the current reproduction number falls. The proportion of the population that have been infected at the point where the current reproduction number falls to one is the ‘herd immunity threshold’ (HIT). Beyond that point the epidemic is under control, and shrinks.
[5] Neil M Ferguson et al.: Impact of non-pharmaceutical interventions (NPIs) to reduce COVID-19 mortality and healthcare demand. Imperial College COVID-19 Response Team Report 9, 16 March 2020, https://spiral.imperial.ac.uk:8443/handle/10044/1/77482
[6] Grifoni, A.et al.: Targets of T cell responses to SARS-CoV-2 coronavirus in humans with COVID-19 disease and unexposed individuals. Cell 11420, 2020 https://doi.org/10.1016/j.cell.2020.05.015
[7] Braun, J., et al.: Presence of SARS-CoV-2 reactive T cells in COVID-19 patients and healthy donors. medRxiv 22 April 2020 https://www.medrxiv.org/content/10.1101/2020.04.17.20061440v1.
[8] Le Bert, N. et al.: Different pattern of pre-existing SARS-COV-2 specific T cell immunity in SARS-recovered and uninfected individuals. bioRxiv 27 May 2020. https://doi.org/10.1101/2020.05.26.115832
[9] Nelde, A. et al.: SARS-CoV-2 T-cell epitopes define heterologous and COVID-19-induced T-cell recognition. ResearchSquare 16 June 2020. https://www.researchsquare.com/article/rs-35331/v1
[10] Lee, C., Koohy, H., et al.: CD8+ T cell cross-reactivity against SARS-CoV-2 conferred by other coronavirus strains and influenza virus. bioRxiv 20 May 2020. https://doi.org/10.1101/2020.05.20.107292.
[11] Such seroprevalence is likely to significantly understate the proportion of the population who have had COVID-19, since asymptomatic or mild disease often results in undetectably low antibody levels (Long, Q. X. et al.: Clinical and immunological assessment of asymptomatic SARS-CoV-2 infections. Nat Med. 18 June 2020 https://doi.org/10.1038/s41591-020-0965-6 . Such patients will nevertheless be immune to reinfection (Sekine, K. et al.: Robust T cell immunity in convalescent individuals with asymptomatic or mild COVID-19. bioRxiv 29 June 2020 https://doi.org/10.1101/2020.06.29.174888).965-6
[12] https://www.ft.com/content/a26fbf7e-48f8-11ea-aeb3-955839e06441. Data updated to 13 July
[13] Tkachenko, A.V. et al.: Persistent heterogeneity not short-term overdispersion determines herd immunity to COVID-19. medRxiv 29 July 2020 https://doi.org/10.1101/2020.07.26.20162420
[14] I think its title gives a slightly misleading impression, although that issue is not central to their paper. It is in fact “persistent” heterogeneity that causes “short-term” overdispersion, albeit that over a short period random variability will have a significant influence. I’m unconvinced by their argument that estimating social-connectivity related susceptibility and infectivity from overdispersion in transmission statistics is likely to lead to significant bias, provided that estimation is based on large-scale transmission and not just a few superspreader events.
[15] Doing so involves dependency on an estimate of the infection fatality rate, but their IFR-inferred proportion of the New York City population that had been infected by early June 2020 looks reasonable, based on the NYS survey suggesting 22.7% of NYC residents had been infected by late March and the ratio of cumulative COVID-19 deaths 23 days later.
[16] They term their λ an “immunity factor”, but it is only partly related to biological immunity. If the causative inhomogeneity is related to biological immunity, λ = 1 + CV2, whereas if it is related to social connectivity (which affects infectivity as well as susceptibility) λ = 1 + 2CV2.
[17] They also obtian a similar estimate for Chicago, but based on a much narrower range of data.
[18] Or λ = 4.7 for a selected subset of States.
[19] The ratio of the standard deviation to the mean of a random variable.
[20] I have excluded NY State data, as their curve for that State shows abnormal behaviour, quite likely due to the early epidemic data being strongly dominated by NY City
Great update Nic. What are your thoughts on various States in the U.S. reaching herd immunity?
Thanks, Christopher. I’m afraid that I don’t follow State level developments in the USA very closely. The only one I’ve looked at much is New York State. IMO herd immunity has already been reached there. A fairly thorough statewide seroprevalence study (a large convenience sample, not random but weighted to match the population) estimated COVID-19 prevalence (cumulative incidence) at 14% by the end of March, since when it will have increased. Notwithstanding the end of lockdown recent trends in both COVID-19 cases and deaths (which started decreasing in April) are downwards.
Thanks Nic. I see that the Aguas paper is supportive of NPIs and claims (assumes) that they significantly suppressed the epidemics in the spring, and consequently that the HIT won’t be reached until later in the year. Do you have any thoughts on that? My impression is that HITs in many strongly affected regions are already reached, and were reached back in March and April which is why infection growth slowed down ahead of any NPIs in some places. But they seem to disagree. Is this just a result of their assumptions about the efficacy of NPIs, and would it be possible to adjust the parameters to remove the assumption of strong NPI efficacy and see what that does to HIT estimates? For example, they conclude that the HIT for England is 20 per cent, but the latest antibody survey shows 6.5 per cent prevalence (9.9 per cent in London). This suggests two to three times more people need to develop antibodies before England reaches its HIT. Yet I agree with Carl Heneghan that new infections in London appear to have peaked by mid-March, before social distancing had really begun, suggesting the HIT is already hit. Can their model be tweaked to allow for this?
Thanks, Will. I agree that it is likely that the HIT had been reached in London before lockdown on 23 March. Indeed, the UK chief medical officer, Chris Whitty, has now admitted as such to a Parliamentary committee. Enland & wales hospital deaths peaked on 8 April, which based on the Imperial College assumptions as to the mean time from infection to symptoms (5.1 days) and symptoms to death (17.8 days, from Chinese data; other studies suggest a longer period in Western countries) implies peak infections were around 16 March. New cases in London peaked near the end of March, likely suggesting peak in infections between 16 and 23 March. Pre-lockdown measures and unforced changes in behaviour may have lowered the HIT somewhat, of course.
I think that Aguas et al.’s use of cases data rather than deaths data may have led them to overestimate the HIT for England relative to that of the other countries; they scaled case data between countries at a single point in time, which does not allow for faster growth in testing thereafter in some countries (e.g. UK) than others. It should be possible in principle to roughly adjust for that, but using deaths data is probably a better option.
Aguas et al. don’t estimate that lockdowns etc. were highly effective. They find maximum resulting reductions in the infection rate of 15% to 40% depending on the country and model variant. Moreover, they have most of the effects of NPI removed before the end of their analysis period. Their HIT estimates should therefore be for a situation in which NPI had little effect. And the non-resurgence of infections in Stockholm and after the end of lockdown in London, New York, etc., supports the case that sufficient people have been infected in many major cities to exceed the HIT there under non-lockdown conditions.
Thanks Nic, that’s very helpful. I agree that using death data is better. Did you see the report ‘Features of 16,749 hospitalized UK patients with COVID-19 using the ISARIC WHO Clinical Characterization Protocol’, which finds an average of 4 days of symptoms pre-admission and 7 days hospital stay (all patients, both deceased and surviving)? Also in England in March and April the death curve lagged the hospital admission curve by 6 days (in NYC it was 5 days). The report ‘Characteristics of COVID-19 patients dying in Italy’ found average 10 days between symptoms and death. These figures have left me confused about where higher estimates of the interval come from, as to me it looks like during March and April in UK and Italy at least the interval was more like 10 days between onset of symptoms and death.
One question is whether the average time between infection and death would have been shorter in the early and peak period of the epidemic because the people dying earlier were the more vulnerable? Also, if most of the deaths are from vulnerable groups, and these groups are clustered in certain contexts such as hospitals and care homes, does this raise questions about how the death curve relates to the pattern of infections in the wider community? This seems to me important as social distancing is likely to have had a stronger impact on transmission in the community than in places like hospitals and care homes.
Sorry to ask so many questions!
Unfortunately the first paper you cite gives no information about the time in hospital for those who died, so it cannot be used for estimating the time from admission to death. One commenter asked “What was the median number of days between admission and death”. The reply from the senior author was “We removed this value as it is not informative when many patients have not completed their admission.”
I’m not sure that the apparent lag between hospital admission and death curves is a fair measure of the mean delay between admission and death given that the distribution thereof is long-tailed.
I’m familiar with the Italian report you mention. You say it found an average of 10 days between symptoms and death. That is not correct. It found the median to be 10 to 12 days (depending on the date of the report). For a long tailed distribution, the average (mean) is somewhat higher than the median.
I think there was probably considerable variation between different European countries in the distribution of the time from symptom onset to death. One of the peer reviewers of the Flaxman et al paper, which used a distribution with a mean of 18.8 (changed during revision to 17.8) days, commented that European data suggested this was too low, being “smaller than preliminary estimates available from hospitalization data in Europe (about 5-6 days from onset to hospitalization, at least 2 weeks in the hospital).
It is quite possible that the time between symptom onset and death was atypically low in March and April in Italy, but I think due more to the hospital system being overwhelmed in the worst affected areas rather than to a higher proportion of more vulnerable people being infected early on. There was little change in the median age of cumulative diagnosed Italian patients between mid-April and mid-July, the median age at death increased slightly, and there not much change in the proportion of dying patients with different numbers of co-morbidities.
I share your concerns about the effects of clustering, although mainly due to their seeding times and transmission characteristics being different in care homes and hospitals than for the community rather than to their populations being more vulnerable. As you say, social distancing is unlikely to have had as much effect in those settings – possibly little effect. For care homes, whose residents seem in most cases to die from COVID-19 in situ rather than in hospital, this issue can (in some countries at least) be largely avoided by using death data only for hospital deaths. I see no easy way of adjusting for the effects of transmission clustering in hospitals, but since deaths in care homes were typically about half total COVID-19 deaths the effects of hospital transmission must be substantially smaller.
When using deaths data, delays between the actual date of death and the date that the death is reported (which drives daily cumulative COVID-19 death reports) also needs to be considered.
Thanks Nic, that’s very helpful.
Thanks Nic for this and your previous analyses. It is refreshing to see analyses that don’t assume a conclusion in advance!
This interview https://youtu.be/GBRcK-od50Q provides a plausible reason why HIT can be reached without the equivalent antibody prevalence. Namely, that a high proportion of the younger population may have some cross immunity developed from exposure to other Covids (eg common cold) and are thus immune, at least at lower viral dose levels.
I would suggest that the fundamental error in using any SEIR model may be to assume that the whole population is susceptible. Surely the S term is an unknown variable to be determined by matching the model to the recorded data?
I played with idea back in May with the data from Wuhan and Italy. It seemed that a reasonable model could be made by assuming only >80 year olds were susceptible with no lockdown effects.
I am sure you are already away of Prof Michael Levitt’s Gomperts curve fits to the data, but if not here is a useful link https://twitter.com/MLevitt_NP2013.
Thanks, Kevin.
I likewise think that a substantial proportion of the uninfected population, possibly particularly the young, probably have a degree of immunity to SARS-CoV-2, likely arising primarily from cross-reactive T-cells formed when infected by common cold coronaviruses (and possibly by influenza or animal coronaviruses). The strength of such immunity, where present, will vary. My modified-SEIR model does allow for this factor, since in addition to variation in susceptibility arising from variation in social-connectivity (and hence frequency of contact with infected people), it assumes substantial variation in (biological) susceptibility, with a significant proportion of the uninfected population being highly resistant to infection.
Over 80 year olds aren’t necessarily much more susceptible to infection that younger individuals, they are just far more likely to die if infected. Walker et al. estimated a lower attack rate for 80+ year olds, although that seems to be due to them having fewer contacts. Data from the Diamond Princess outbreak is more relevant to biological susceptibility, as cruise ship passengers will tend to have more similar levels of contacts across age groups. Focusing on 60+ year olds to avoid inclusion of a significant proportion of crew memebrs (who will have different contact patterns), the proportion testing positive was 22% for 60-69 years olds and 27.8% for 80-89 year olds. So higher, yes, but not hugely so.
I’m aware of Prof. Levitt’s Gompertz curve fits. I think that they capture the same phenomenon as do my modified-SEIR models, and those in the recent Aguas et al. and Tkachenko et al. papers (see https://nicholaslewis.org/why-herd-immunity-to-covid-19-is-reached-much-earlier-than-thought-update/), but without providing insight into the underlying reasons for this behaviour.
It seems pretty clear at this point that the models predicting a lower HIT are right and the older models are wrong. How widely accepted is that view among epidemiologists at this point? Is it a consensus yet or still debated?
My impression is that, among epidemiologists who are aware of the point and considering its effects, it is still debated as to the extent of the reduction. Worse, many epidemiologists seem unaware of the point. However, I am not directly involved in the epidemiology community so I may be wrong.
In any event, the epidemiological models I have examined that have been used for advising on and appraising government interventions (NPI) seem to take little or no account of population heterogeneity and hence assume that the HIT is very high, close to or equal to that for a homogeneous population or for vaccination at random.
Hi Nic, thanks for the update on the Tkachenko et al. paper!
Is it the case that if you set lambda=1 you expect to approximately recover the Imperial college model?
Yes; in principle exactly so for the Flaxman et al Imperial College model used for Bayesian analysis, provided their probability distribution for infectiousness is matched.
The more complex Ferguson et al Imperial College simulation model does allow to a modest extent for heterogeneity in contact rates, arising inter alia from simulating different settings (households, workplaces, school, community) and allowing for geographical separation. However, the proportion of the population that it estimates would ultimately be infected in an unconstrained epidemic is fairly close to that for a model with a completely homogeneous population (lambda=1), implying that the effective lambda value is not much above 1 for the Ferguson et al. model.
Great article. We have modeled multiple states, with various degrees of heterogeneous connectivity, susceptibility and time based age segregated activity and show that we are indeed reaching herd immunity thresholds. If you look by age groups, 0-20 really don’t drive this infection at all. The older folks are not really infection drivers either, more victims when they do get it, but not really spreaders. The younger to middle age adults are the engine of the disease, and when they hit above 35% infected, things slow down, and 50% really damps things down. This correlates to overall infection rates in the 30% range to reach HIT. We assume 50% asymptomatic cases are part of this total. NYC likely established herd immunity by mid April. Florida, Texas, Arizona and pretty soon California will be reaching HIT thresholds as well. Overall death counts will vary as the vulnerable and the elderly are protected, as the overall infection rates fall. Check out our analysiss: http://www.covidplanningtools.com
Thanks. I’m aware of your website. Your model looks impressive, but as I haven’t yet found any way to access your model code or any detailed model documentation I have gone no further.
I very largely agree with what you say about age groups driving the epidemic, particularly after the first month or so, although I’m not sure that teenagers have a negligible role. I think there is evidence that asypmtomatic cases do become immune (they probably already had a fair degree of resistance to SARS-CoV-2 infection, but not enough to prevent the virus multiplying to a level detectable by the very sensitive RT-PCR test), so they will count towards the HIT. Asymptomatic cases may however in many cases not lead to the production of detectable levels of antibodies, with effective immunity being mediated primarily by generated SARS-CoV-2 specific T-cells.
I likewise concluded that NYC reached herd immunity in April. I think London and Stockholm have also done so, and no doubt various other major cities as well. I view Stockholm as an important case study, since it never had a lockdown and behaviour now seems not to be too far off normal. The same goes for Geneva, save that it did have a lockdown originally. Deaths there are now virtually zero, with new infections non-negligible but very few of them in the 70+ age groups where almost all the deaths occurred. It looks as if the proportion of the population who have been infected is in the 15-25% range, 70% of them being aged 30 to 59..
Fascinating discussion on the ages that drive the spread! Is it known why the under 20 cohort don’t contribute meaningfully to this?
I’m not sure why it is in relation to the 10-19 age group; the 0-9 age group appears to be minimally infective.
I’ve read evidence suggesting that the infectiousness of older children is not appreciably lower than that of adults – possibly even a bit higher. And their contact rate doesn’t seem to be thought to be lower than that of adults, although presumably it is largely with other people in their age group – and may have been substantially reduced by school closure.
It could be that people under 20 are simply more resistant to being infected. That would lead to a lower incidence of infection in them, so that they contribute relatively little to the spread. If relatively few 11-19 year olds are infected, that age group is difficult to infect, and they have limited contacts with older age groups, then they will contribute little to the growth of the epidemic. However, I note that in Geneva canton seroprevalence in April/May was similar in 10-19 year olds to in 20-49 year olds, so that possible explanation seems unlikely.
Nic, have you seen the new paper purporting to show the effectiveness of lockdowns, in the tradition of Flaxman et al? https://journals.plos.org/plosmedicine/article?id=10.1371/journal.pmed.1003244
It looks to me like it makes similar mistakes, but I’d be interested in your thoughts.
Will, Thanks for the link. I hadn’t spotted that study. I’ll take a look.
Thanks Nic. Incidentally did you see this analysis of Stockholm data suggesting a mean infection-death interval of 19.8 days? https://mobile.twitter.com/cheianov/status/1275804853621661696
It seems very rigorous. Oxford CEBM refer to it in their latest consideration of the CFR in England https://www.cebm.net/covid-19/the-declining-case-fatality-ratio-in-england/.
Thanks, Will. I hadn’t seen the analysis that you refer to, but I was aware of the dataset that it analyses, which looks fairly solid for Sweden albeit still slightly affected by right censoring. However, there is a major problem in applying elsewhere an estimate derived from Swedish data. The majority of deaths that occur an above average time after symptoms appear arise in patients given intensive care, generally involving intubation. And most are in 80+ year olds. In Sweden, unusually, very few 80+ year olds with severe COVID-19 have been given intensive care, so the usual long tail of the delay from symptoms appearing (or from infection) to death is greatly reduced.
Thanks Nic. I don’t know if you’re on Twitter but the author of the Twitter thread was asking if anyone had thoughts about why the datasets were so different. Sounds like you have a good idea.
Curious if you have an explanation for why Portugal has such a low HIT – 6% – according to Gomes?
You are referring to the Aguas et al preprint., I assume. No, I don’t have a good explanation. I’m not sure how accurate their fitted models are. But if a 6% HIT is correct, it could reflect people in Portugal continuing to behave cautiously after lockdown was lifted to a greater degree than elsewhere and/or than assumed in the modelling.
Yes exactly, the Aguas et al. paper, and thanks for the reply as always. FWIW Gomes says this 6% HIT estimate assumes no cautious behavior or other mitigations.
Nic, the IHME model is predicting a huge ramp up in the death rate in the U.S. through the rest of the year. Does this have any reasonable chance of being right in you view? The current total is 186k as of Sept 4 and their prediction is 410k by year end.
It sounds unlikely to me, but I don’t follow the disease progress in the USA very closely. If the post-May increase in cases in the USA is primarily in younger age groups than before then, as in Europe, then the previous relationship between cases and deaths will vastly overpredict deaths going forward, since the IFR is so strongly related to age. And on top of that IFR has probably dropped for all age groups, inter alia as treatment has improved. If the IHME death projections are based to any extent on the growth in total cases, the above effects would result in an excessive projection of deaths.
However, if this is the explanation then I would expect the IHME model to have overestimated deaths in July and August as well.
i am sorry i don’t have a citation, but 20 years or so ago Dr. David Williams wrote about the aspirin /cytokine interaction in the 1918 flu…and when those children died in NYC (Kawasaki underlying), i checked and the preferred pain reliever for them (not for most children) is aspirin.
Thanks; interesting. I believe that when people die from COVID-19 a bradykinin storm is now thought most likley to be responsible, but triggered in a different way from what was originally contemplated.
Hi Nic. Have you seen this new study? https://www.thelancet.com/journals/laninf/article/PIIS1473-3099(20)30785-4/fulltext#seccestitle130
They conclude closing schools and banning public events has the largest impact. But acknowledge that they were usually the first interventions and this may just reflect that. In terms of increases after lifting them, they acknowledge that they don’t allow for increases in testing, yet the early summer (when most of the restrictions were being lifted) was when testing was being ramped up, so surely much of the increase would be that? Particularly as in the late spring/summer the virus was in decline in most places so it’s odd to see them claiming that R was going up at that point. They say they don’t take seasonality into account, though cite a model that shows the temperature and humidity don’t make any difference(!) despite it being clear now that it faded in most places in summer and is having a seasonal resurgence in the autumn. They also try to claim schools are major drivers of infection, citing one study about the viral load in 5 year-olds but ignoring all the studies that show it made little or no difference.
They acknowledge that there were varying delays in the interventions having an effect, with a median of 8 days to have 60% of the effect, which seems a very long delay for an impact that should surely be immediate. They claim this is likely to be a result of behavioural inertia, which they say is backed up by Google mobility data, but don’t go into detail. I don’t really see how behavioural inertia can explain a delay in the impact of the closure of schools, which is surely an immediate universal behavioural change. Likewise if public events are banned then they are banned. Whence then the delay and variation?
I don’t see any sign that they have considered how much of the decline in R could be due to natural epidemic decay (and the increases due to increased testing). Their limitations discussion was pretty comprehensive, but I still feel like they assume their conclusion (that NPIs work) and thus don’t consider the possibility that the reduction in R would have happened anyway.
I’m open to the possibility that NPIs can reduce transmission somewhat if introduced early enough, which may be why some places are seeing more of an autumn resurgence than others (though I think basic hand hygiene and conscientious self-isolation of the symptomatic will probably have had most impact). But I’m not sure this study really demonstrates what it claims to. What do you think?
Thanks, Will. As it happens I printed out a copy of that paper earlier today and hope to study it within the next couple of days. Until then I’m unable to comment on it.