A pdf copy of this article is available here.
Key points about the recent Nature paper by Flaxman and other Imperial College modellers
1) The transition from rising to declining recorded COVID-19 deaths in the in 11 European countries that they studied imply that transmission of COVID-19 must have reduced substantially.
The study was bound to find that together the five government non-pharmaceutical interventions (NPI) they considered contributed essentially 100% of the reduction in COVID-19 transmission, since in their model there is nothing else that could cause it.
2) The prior distribution they used for the effects of NPIs on transmission in their subjective Bayesian statistical method hugely favours finding that almost all the reduction in transmission is due to one, or possibly two, NPIs with all the others having a negligible effect.
The probability density of the prior distribution at their median estimates of the effect on transmission of each type of NPI, which allocate essentially all the reduction in transmission to lockdowns, was many billion times greater than it would have been if the same total estimated reduction had been spread evenly across the types of NPI.
3) Which intervention(s) is/are found to be important depends critically on the assumptions regarding the delay from infection to death. When using their probabilistic assumptions regarding the delay from infection to death, a huge (and highly improbable given other assumptions they made) country-specific effect is required to explain the reduction in transmission in Sweden, where no lockdown occurred. If delays from infection to death are increased by just three days, their model no longer finds lockdowns to have the largest effect, and a more moderate country-specific effect is required to explain the reduction in transmission in Sweden.
4)The estimated relative strengths of different NPIs are also considerably affected by the use of an alternative prior distribution for their effects on transmission that does not strongly bias the estimation of most of them towards a negligible level. They are also considerably affected by phasing in over a few days the effects of the two NPIs that seem unlikely to have had their full effect on their date of implementation.
5) It follows from the above that that study provides no information whatsoever as to the actual contribution from all NPI combined to the reduction in transmission, and nor does it provide robust estimates of relative effects of different NPI.
Introduction
On 8 June 2020, Nature published a paper (Flaxman et al. 2020[1]) by modellers in the Imperial College OCIVD-19 response team. Its abstract ends with:
Our results show that major non-pharmaceutical interventions and lockdown in particular have had a large effect on reducing transmission. Continued intervention should be considered to keep transmission of SARS-CoV-2 under control.
Using a counterfactual model, the paper also estimated the impact of interventions on deaths from COVID-19 in the 11 European countries studied, saying:
We find that, across 11 countries, since the beginning of the epidemic, 3,100,000 [2,800,000 – 3,500,000] deaths have been averted due to interventions.
The mainstream media publicised the ‘3 million deaths saved’ claim, without critically appraising the paper or, generally, mentioning the relevant caveat in the paper:
The counterfactual model without interventions is illustrative only and reflects our model assumptions.
In Imperial College’s press release Dr Flaxman ignored his own caveat, saying
Using a model based on data from the number of deaths in 11 European countries, it is clear to us that non-pharmaceutical interventions– such as lockdown and school closures, have saved about 3.1 million lives in these countries
In this article I examine the main claim – that major non-pharmaceutical interventions (NPI) have had a large effect on reducing transmission of COVID-19, to which the inferred reduction in deaths is attributable, with almost all the reduction due to lockdowns. I show that this claim is strongly dependent on the assumptions made and is highly dubious.
The case of Sweden, where the authors find the reduction in transmission to have been only moderately weaker than in other countries despite no lockdown having occurred, is prima facie evidence against the paper’s main claim.
How the effects of lockdowns and other interventions were estimated
Flaxman et al. employ a ‘hierarchical Bayesian’ statistical model. It uses data on daily deaths (up to 5 May 2020, when two countries relaxed their lockdowns), the dates of imposition of five types of NPI (school or university closure, case-based self isolation, public events banned, lockdown ordered and social distancing encouraged), and estimates of the infection fatality rate, for each of 11 European countries.[2] Using these data, the model infers what time profiles of the effective reproduction number (Rt, the number of people whom an infected person in turn infects) – and hence of new infections – would produce the best match between projected and recorded deaths for each country. To do so it uses a simple model of epidemic growth and probabilistic estimates, common to all countries, of the time from infection to death and of the generation time (that from a person becoming infected to them infecting others). The assumed infection fatality rate (IFR) is common between countries for each age band, but reflects the age-structure of each country’s population. It averages slightly over 1%.
A separate initial value, R0 (the basic reproduction number), of the reproduction number Rt is inferred for each country. Rt then changes from R0 in stepwise fashion at the date of each NPI, which act multiplicatively with an equally strong inferred effect for all countries. Each country’s epidemic is seeded by a series of infections starting 30 days prior to a total of 10 recorded deaths.[3]
The model is described in more detail here, and is illustrated in Figure 1, taken from Flaxman et al.
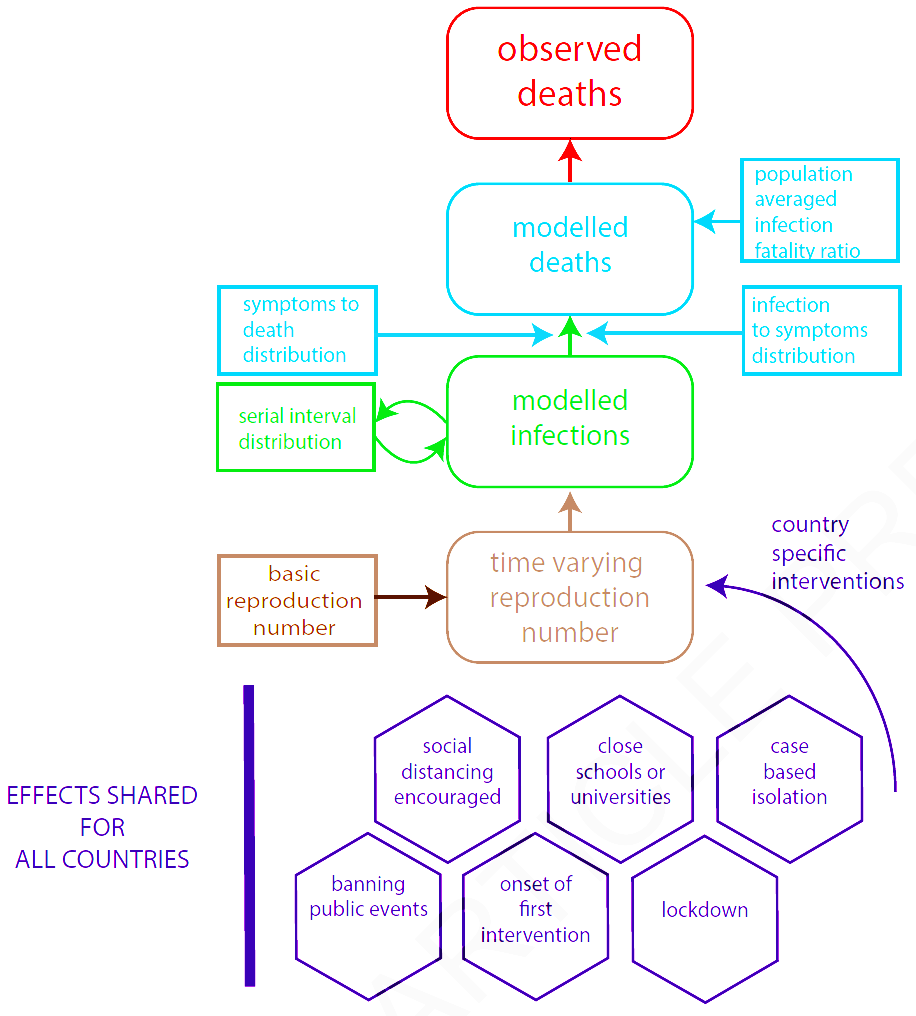
Fig. 1. Reproduction of Flaxman et al. Extended Data Fig. 3: Summary of model components
The treatment of interventions
The model uses no information on NPI’s except their type and their implementation date in each country. NPI of each type are treated as having the same (multiplicative) effect on Rt in each country. Each type of NPI is treated identically. As well as the five types of actual interventions, all first interventions (whatever type) are treated as an extra type of intervention, for each country occurring on the date of implementation of its first actual NPI (almost always either self isolation or public events ban, and never lockdown). Hence there are six NPIs with shared values for all countries.
In addition, a pseudo-NPI with a strength that is estimated separately for each country is treated as taking place on the same date as the last actual NPI. These country-specific pseudo-NPIs allow for variation between countries in the effectiveness of the implementation of their NPI. They are probabilistically constrained to be relatively small, making a country-specific effect large enough to cause a halving of Rt exceedingly improbable.
In all 11 countries the exponential growth in infections and deaths experienced early in the epidemics slowed and then turned negative, with infections and deaths decreasing. This implies that in all 11 countries Rt decreased very substantially, to below one, since the start of their epidemics.
In the Flaxman et al. model the only factor that can cause Rt to decrease significantly is the effect of each NPI. Therefore, the estimated overall effect of the NPIs in reducing Rt, and hence deaths resulting from COVID-19 disease, is bound to be very strong.
The only non-NPI factor that affects Rt in the Flaxman et al. model is the reduction arising from the proportion of the population susceptible to infection (set at 100% initially) gradually diminishing over time due to individuals already infected by COVID-19 becoming immune to it. This reduction is very small in their model, for two reasons:
- they make the very unrealistic assumption that all individuals in a country are equally susceptible to COVID-19 and, if infected, are equally likely to infect others.
- the relatively high infection fatality rates they assume result in only very small proportions of countries’ populations becoming infected in their model.
Therefore, their model has to attribute almost all the overall reduction in Rt to government interventions.
Factors not considered by Flaxman et al., all of which are highly likely to have caused some reduction in COVID-19 transmission, and which between them may well have caused substantial reductions in Rt in all 11 countries, include:
- population heterogeneity in social connectivity – which generates highly correlated heterogeneity in both susceptibility and infectivity – and in other factors determining susceptibility to COVID-19
- unforced changes in the behaviour of individuals as they adjust it to reflect COVID-19 risk
- seasonal factors: infections by common coronaviruses peak in the winter and diminish greatly as spring progresses.
As is well known by competent epidemiologists, the first of the above-mentioned factors causes Rt to diminish faster, potentially much faster, with the number of people who have been infected than if it were proportional to the number of people remaining uninfected, as assumed by Flaxman et al. The other factors directly reduce Rt.
If follows that Flaxman et al.’s counterfactual case, which predicts ~3,200,000 deaths in the absence of any NPIs (their ‘counterfactual model’), is completely unrealistic, as therefore is their estimate of 3,100,000 lives saved by interventions.
It also follows that Flaxman et al.’s claim:
Our estimates imply that the populations in Europe are not close to herd immunity (~70% if R0 is 3.8)
may be invalid. As shown here, due to population heterogeneity in susceptibility and infectivity the herd immunity threshold it is bound to be lower – quite possibly very substantially so – than if, as required for it to be ~70% at an R0 of 3.8, populations are homogeneous.
Flaxman et al.’s assertion that all the reduction in transmission (i.e., the reduction in Rt) was due to NPIs, other than very small reduction as more people have been infected and become immune, is unsound. Nevertheless, it seems quite likely that NPIs have had a significant, perhaps substantial, effect on Rt. However, given the confounding effects of the other factors mentioned it is impossible reliably to estimate the total effect of NPIs on Rt and hence on deaths.
Even when making the unrealistic assumption that almost all the reduction in Rt was due to interventions, any allocation of that reduction between the NPIs is very fragile. Flaxman et al. accept this in relation to NPIs other than lockdown, writing:
Most interventions were implemented in rapid succession in many countries, and as such it is difficult to disentangle individual effect sizes of each intervention. In our analysis we find that only the effect of lockdown is identifiable, …
On their median estimates, lockdown caused an 82% reduction in Rt, whereas no other NPI caused as much as a 1% reduction in Rt. While it would not be particularly surprising if such a drastic intervention as lockdown had had stronger effects than other NPIs, even if lockdown had a strong effect one would expect some other NPIs to have had a significant effect. So how did Flaxman et al. find that, remarkably, almost the entire effect of interventions was due to lockdown? The answer, which turns out to be two-fold, shows that their finding is not credible.
Why Flaxman et al. found almost all reduction in COVID-19 transmission to be attributable to a single intervention
Flaxman et al. use a subjective Bayesian statistical method. I have repeatedly criticised this type of Bayesian method in the climate science field, but – probably due to its ease of use – it remains standard practice there and in many other fields.
A subjective Bayesian method requires prior probability distributions to be assigned for each unknown parameter whose value is to be inferred. These prior distributions are then modified by the likelihood function, which reflects how well the modelled deaths fit the daily deaths data at varying values of the parameters, in order to arrive at a ‘posterior’ probability distribution for the parameter values. They use a common method of achieving this that results in a large number of quasi-random draws (‘posterior draws’) from the derived posterior probability distribution.
They represent the strength of interventions by a six dimensional parameter alpha (five actual NPIs plus the synthetic first intervention NPI), with the corresponding effect of intervention i (i being 1, 2,3, 4, 5 or 6)[4] on Rt being to multiply it by exp(-alpha[i]).
The combined effect of all interventions is then to multiply Rt by exp[-(alpha[1] + alpha[2] + alpha[3] + alpha[4] + alpha[5] + alpha[6])][5], which depends only on the sum of the individual alpha values. Their own posterior draws show a median value of the sum of the alphas of 1.75, which corresponds to an 83% reduction in transmission (1 – e−1.75 = 0.83).
The prior distribution assigned by the authors to the strength of the reduction in Rt caused by each intervention is of particular concern. Each of the six alpha values is assigned a gamma-distributed prior probability distribution; a small offset is applied, so that the gamma-distributed values inferred initially are marginally higher, but that is a cosmetic feature.[6] The authors write:
The intuition behind this prior is that it encodes our null belief that interventions could equally increase or decrease Rt, and the data should inform which.
That is not in fact true. As the left hand panel of Figure 2 shows, their prior allows each intervention to decrease Rt by up to 100%, but only to increase it by less than 1%. And the combined effect on transmission of all interventions (right hand panel) can only vary between –100% and + 5%. However, since the trajectory of the deaths data is, on their assumptions, bound to result in all interventions combined being found to strongly reduce transmission, the +5% limit is of no real consequence.
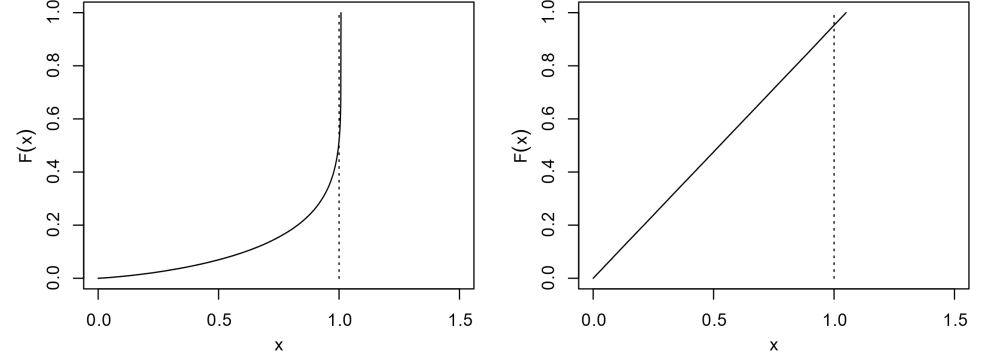
Fig. 2. Reproduction of the upper panels of Flaxman et al. Supplementary Fig. 3: Cumulative distribution function F(x) of the prior for one intervention’s multiplicative effect x (= e–α) on transmission (left) or for the effect of all interventions combined (= e–Σα) (right).
On the face of it, the combined effect of the six-dimensional joint alpha prior distribution looks fairly uniform over the range in which the estimated reduction in Rt could fall; it assigns a similar probability to a reduction in the range 40% to 50% and in the range 80% to 90%, for example. However, that only looks at one aspect of the six-dimensional prior distribution.
If I take the sum of the six alphas to be 1.75 (the median sum from their posterior draws) and set them to be all equal, at 1.75/6, their joint prior probability density is 0.0023. But if I set one of the alpha values to 1.70 and the remaining five to 0.01, giving the same overall reduction in transmission, the prior probability density is 64.3. That means their prior distribution assigns a 28,000 times higher prior probability assumption to this case, where one type of intervention has a completely dominating effect relative to all the others, than to a case where the same overall reduction in transmission is caused equally by all types of intervention. The reason is that the offset-gamma distribution used assigns a strongly increasing probability density as an alpha value decreases towards −0.008, its lowest permitted level, favouring cases where the effect of all but one or two NPIs is estimated to be almost zero.
So it is unsurprising that they found a single intervention to be totally dominant.
The median individual alpha values in their 2,000 archived posterior draws are −0.007, −0.007, −0.007, −0.007, 1.699 and −0.006. So all interventions except lockdown were estimated to have a completely negligible effect.
The median ratio, across their own posterior draws for alpha, of the actual prior probability to what it would have been if in each draw the total effect of the intervention had been spread evenly across them, was in fact 392 billion to one!
It is not clear that the authors realised that the prior distribution they used very strongly favoured finding that most interventions had a negligible effect, and I very much doubt that any of the peer reviewers appreciated that this was the case.
The Sweden problem
Using the code and data accompanying the Nature paper as is, except with the 8,000 draws split between 4 not 5 chains to better match my computer, I can accurately replicate Flaxman et al.’s findings, with lockdown accounting for almost the entire reduction in Rt (Figure 3).
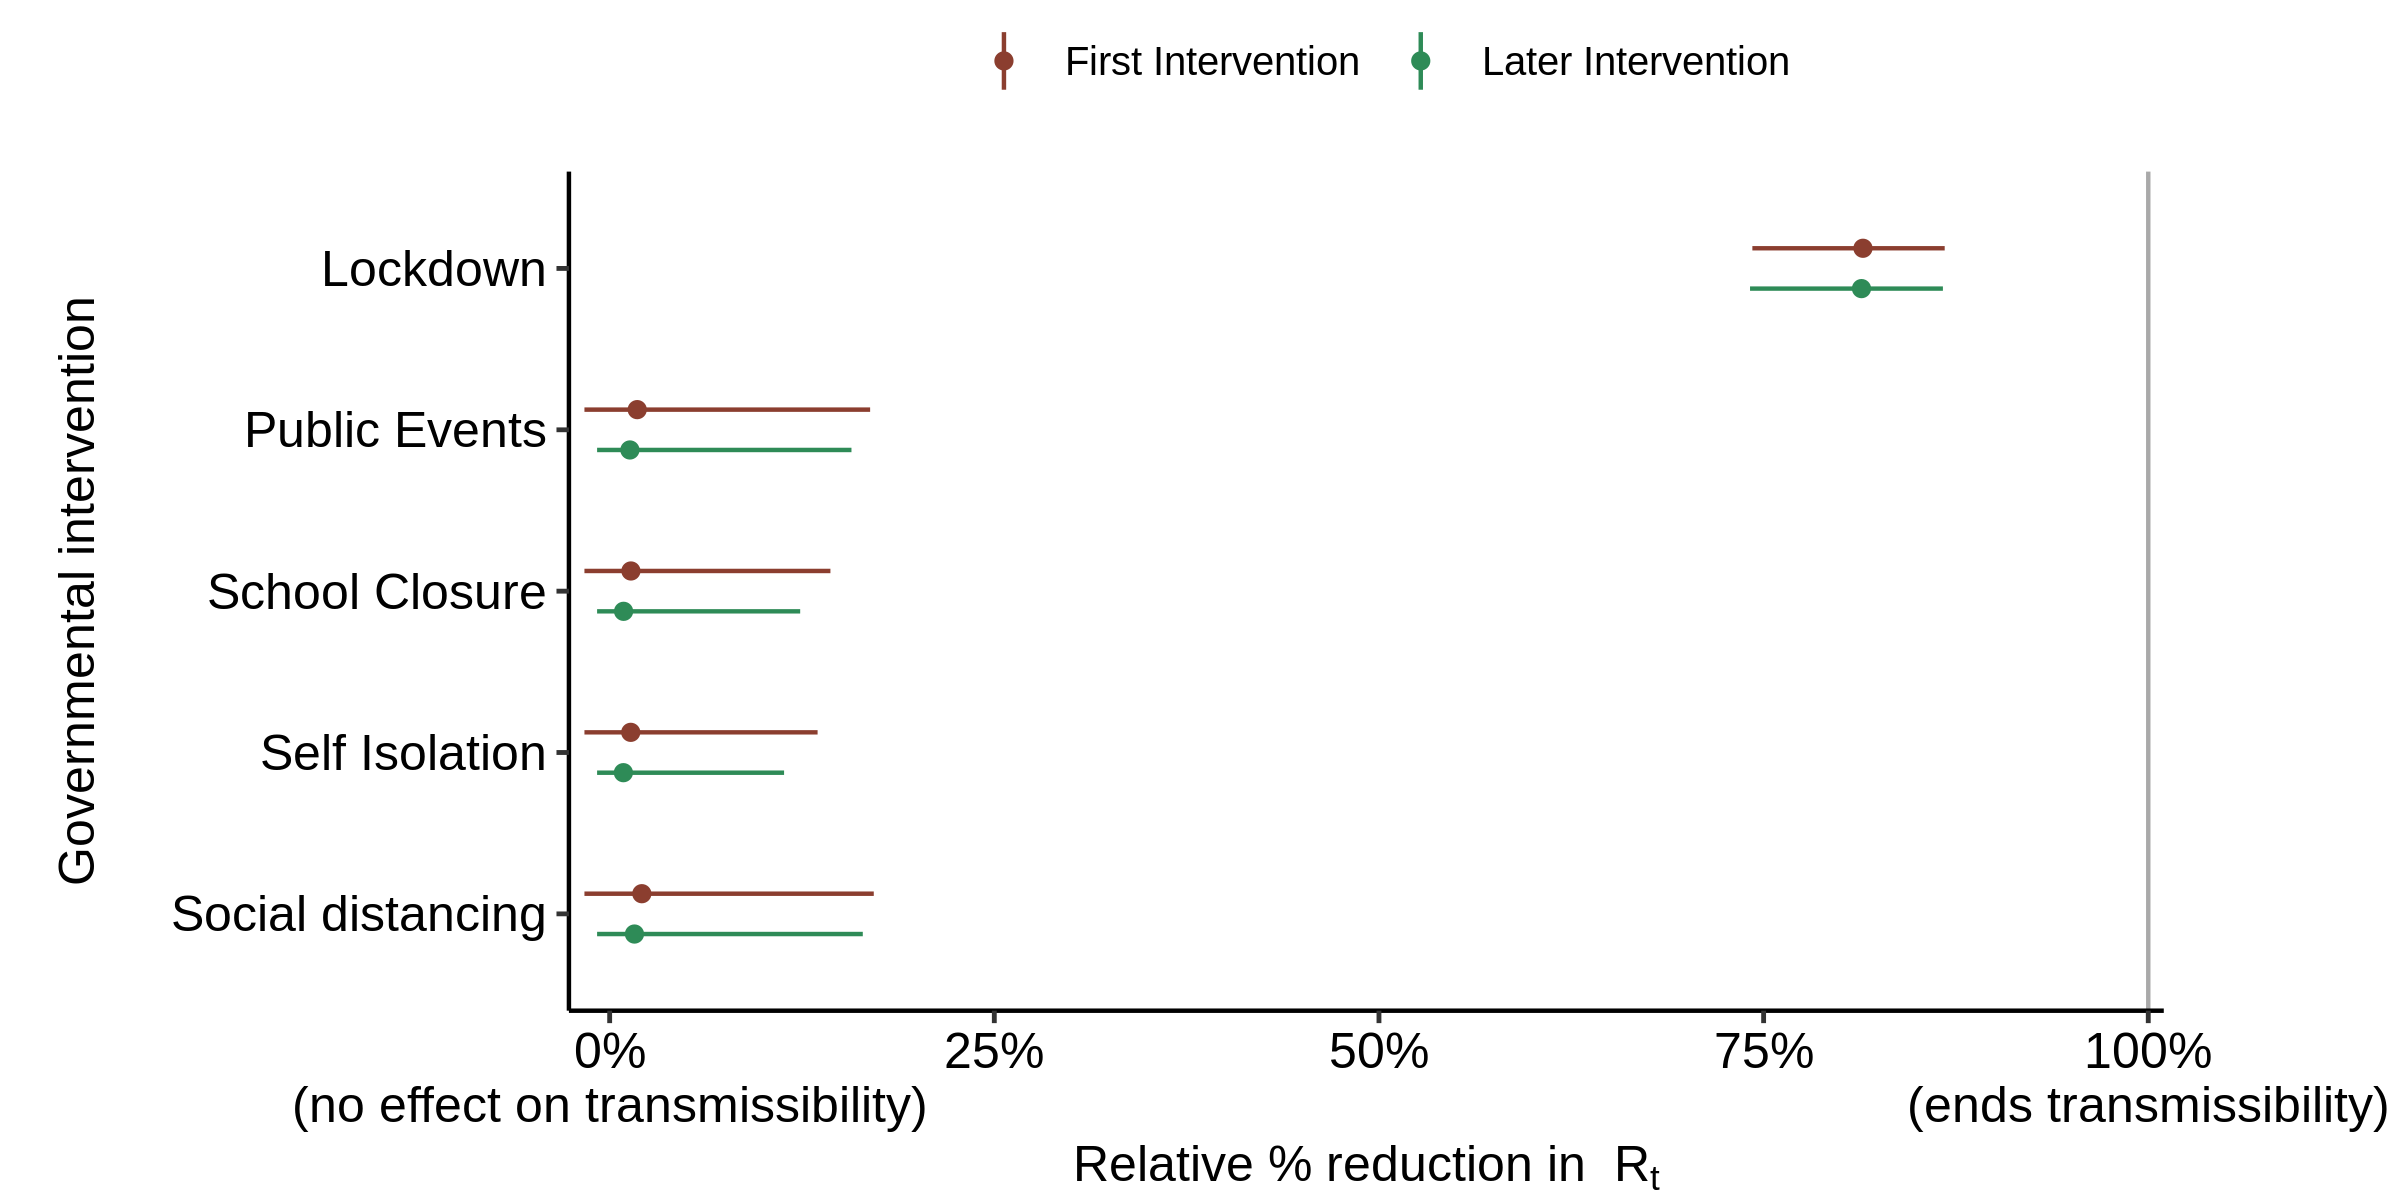
Fig. 3. Effect of interventions on Rt in the base case, with all aspects of the model as per the original version (that archived for the Nature paper). The red First intervention estimate includes the effect of the synthetic first intervention NPI and so only applies for countries where the NPI concerned was the first to be implemented; it should be ignored in all other cases. Mean relative percentage reduction in Rt is shown for each NPI (filled circle) together with the 95% posterior credible intervals (line). If 100% reduction is achieved, Rt = 0 and there is no more transmission of COVID-19.
Sweden did not have a lockdown, but it still had a large reduction in Rt, albeit one not quite as large as the average for other countries. So how did the model account for that? This is where the country specific factors, which are treated as occurring on the date of the last actual intervention and in effect are an addition to its alpha, come in.
The country specific factors are given an apparently small influence, being zero-mean normally distributed with a standard deviation that is itself zero mean normal+ distributed[7] with a standard deviation of 0.2. But for Sweden a value of 1.27, in the far tail of the resulting distribution, was inferred. The probability of such a large country factor arising by chance appears to be about 1 in 2,000. That in itself implies that their model does not adequately represent reality.
Using a less informative prior
I investigated use of a prior distribution for the six alpha parameters that was essentially flat over the alpha parameter range relevant for NPI, both for each parameter separately and for the six-dimensional joint alpha parameter. For technical reasons, rather than using a uniform distribution I chose an independent zero mean normal distribution with a standard deviation of 10 as the prior distribution for each parameter. I hereafter refer to this as the ‘flat prior distribution’, even though it is not quite flat over the parameter range of interest (approximately 0 to 2).
I then ran the model using the same assumptions, but using the flat prior distribution rather than the original offset-gamma prior distribution. Doing so should eliminate the previous strong bias towards finding that most interventions had almost no effect.
The resulting estimates of the effect of each intervention were as shown in Figure 4. The estimated effects of NPI other than lockdown all increase markedly from their near zero values when using the original prior, but the contribution of lockdown remains dominant.
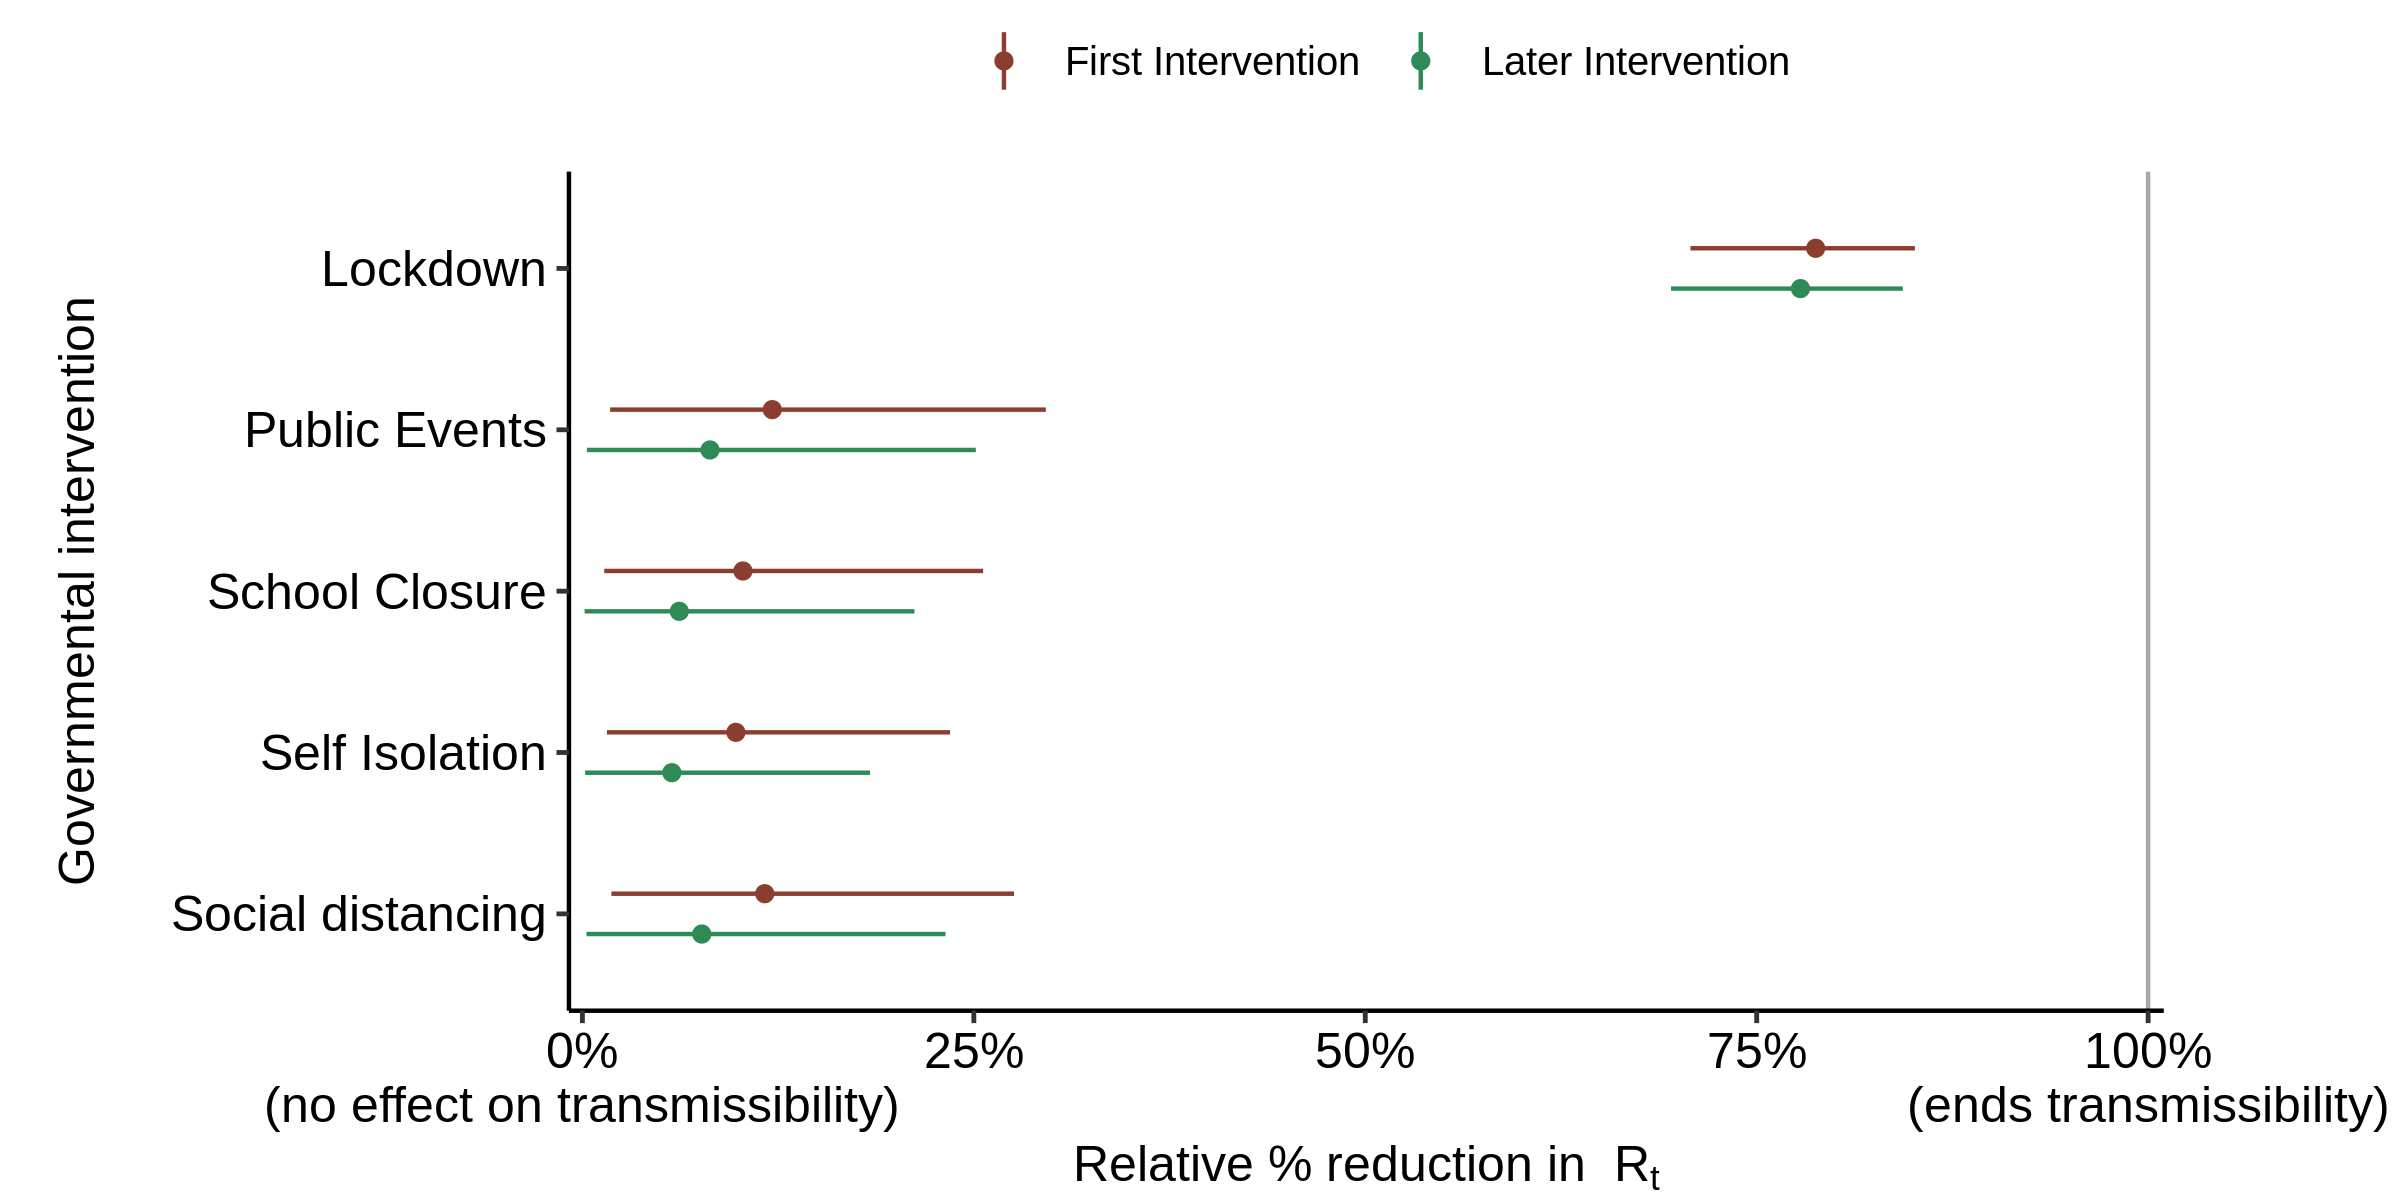
Fig. 4. Effect of interventions on Rt : as in Fig. 3, but with the flat prior distribution for alpha substituted for the offset-gamma prior distribution in the original model..
The country specific factor for Sweden was slightly less high than before, at 1.12. The probability of such a large country factor arising by chance appears to be about 1 in 900; still minute.
So, even when using the flat prior, the Flaxman et al. model does not adequately fit reality. The problem is that, as it still estimates lockdown to account for the vast bulk of the total reduction in Rt, it cannot adequately account for the reduction in Rt that occurred in Sweden, where there was no lockdown.
Why Flaxman et al. found lockdown was the intervention that dominated the reduction in COVID-19 transmission
I have explained why it to be expected, given Flaxman et al.’s choice of prior distribution for the effect of interventions on the transmission of COVID-19, that a single type of intervention (or at most two types) would account for the vast bulk of the reduction in Rt. But why lockdown?
The key here seems to be that lockdown was, other than in Sweden, on average imposed at a point in time that, allowing for the assumed probabilistic delay between infection and death, would result in deaths peaking at about the time that they actually peaked. Also, the timing of lockdown, relative to the peak in recorded deaths, differed slightly less between countries that locked-down than was the case for most other interventions.
Flaxman et al. took probabilistic estimates of the delay from infection to symptoms appearing and from symptoms appearing until death, with assumed mean values of 5.1 and 17.8 days respectively, and added them to obtain the infection to death delay values. The 5.1 day delay from infection to onset of symptoms seems reasonable. But the 17.8 days mean from onset of symptoms until death looks as if it may be on the short side for European countries. Ideally, a separate onset of symptoms to death delay distribution would have been estimated for each country. However, the authors may well have been unable to find suitable European data. They actually used a value estimated by Verity et al.[8] (also members of the Imperial College COVID-19 modelling team) from just 24 cases in mainland China.
One of the peer reviewers suggested that the value Flaxman et al. were using for the delay from onset of symptoms until death of (in the originally-submitted manuscript[9] being reviewed)18.8 days, not 17.8 days, was rather short, writing:
it is smaller than preliminary estimates available from hospitalization data in Europe (about 5-6 days from onset to hospitalization, at least 2 weeks in the hospital)
I therefore increased the average delay from onset of symptoms to death slightly.
I also took the opportunity to correct the dates used in the model inputs for school/university closure in Sweden and for self-isolation in Spain to those given in Flaxman et al. Extended Data Figure 4, which agree to those in their Supplementary Table 2.
I found that adding 3 days to the infection to death delay, bringing the average onset of symptoms to death delay to ~21 days (median 19.6 days) – which is fully consistent with the peer reviewer’s comment – was adequate to reduce the problem of Sweden needing a very large country-specific factor. That factor was then estimated at ~0.4, to match the reduction in transmission in Sweden – still over twice as large as for any other country, but no longer statistically-inconsistent with their assumptions.
The resulting estimated effectiveness of the various interventions, using the authors’ original prior distribution for alpha, is shown in Figure 5.
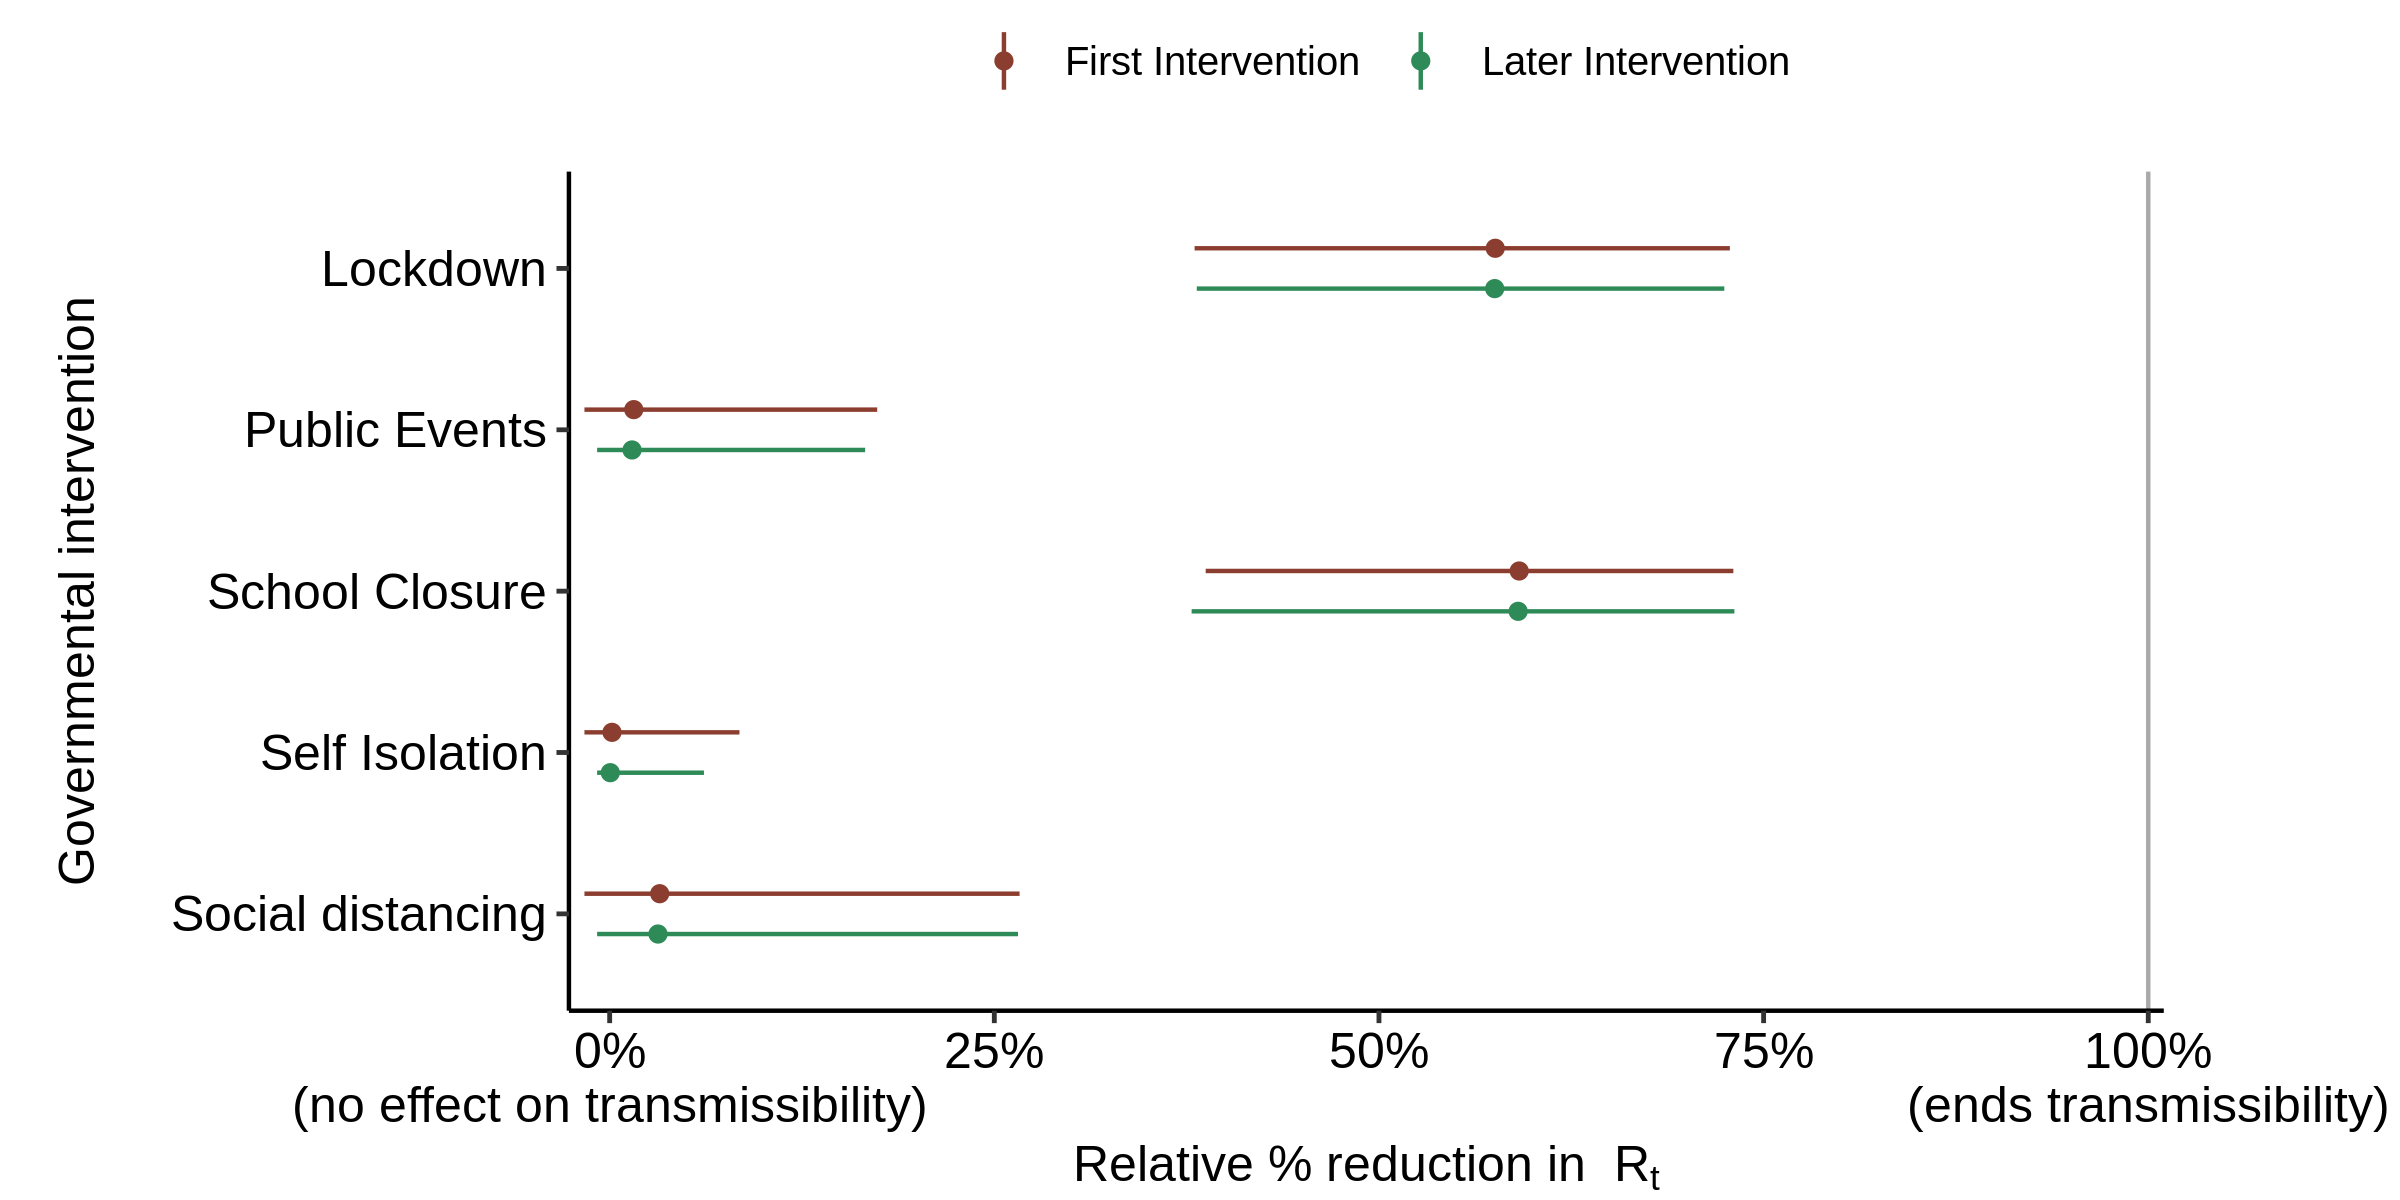
Fig. 5. Effect of interventions on Rt : as in Fig. 3 (original prior) but with the infection to death delay increased by 3 days, and one intervention date corrected for each of Spain and Sweden (see text).
School closure is now found to have a slightly stronger effect on transmission than lockdown. This may seem rather unlikely in reality, but the model has no information to go on regarding the likely relative strengths of each type of intervention – it just knows when they were implemented in each country. Other interventions are found to have almost zero median effect, as is to be expected given the nature of the original prior distribution.
Using instead the flat prior gives slightly different estimates of the effectiveness of the various interventions (Figure 6), with school closure not having quite as strong an effect as when using the original prior. The effects of social distancing, and to a slightly lesser extent public events ban and self isolation (one of which is generally the first intervention, so the red line applies to it), all cease to be negligible.
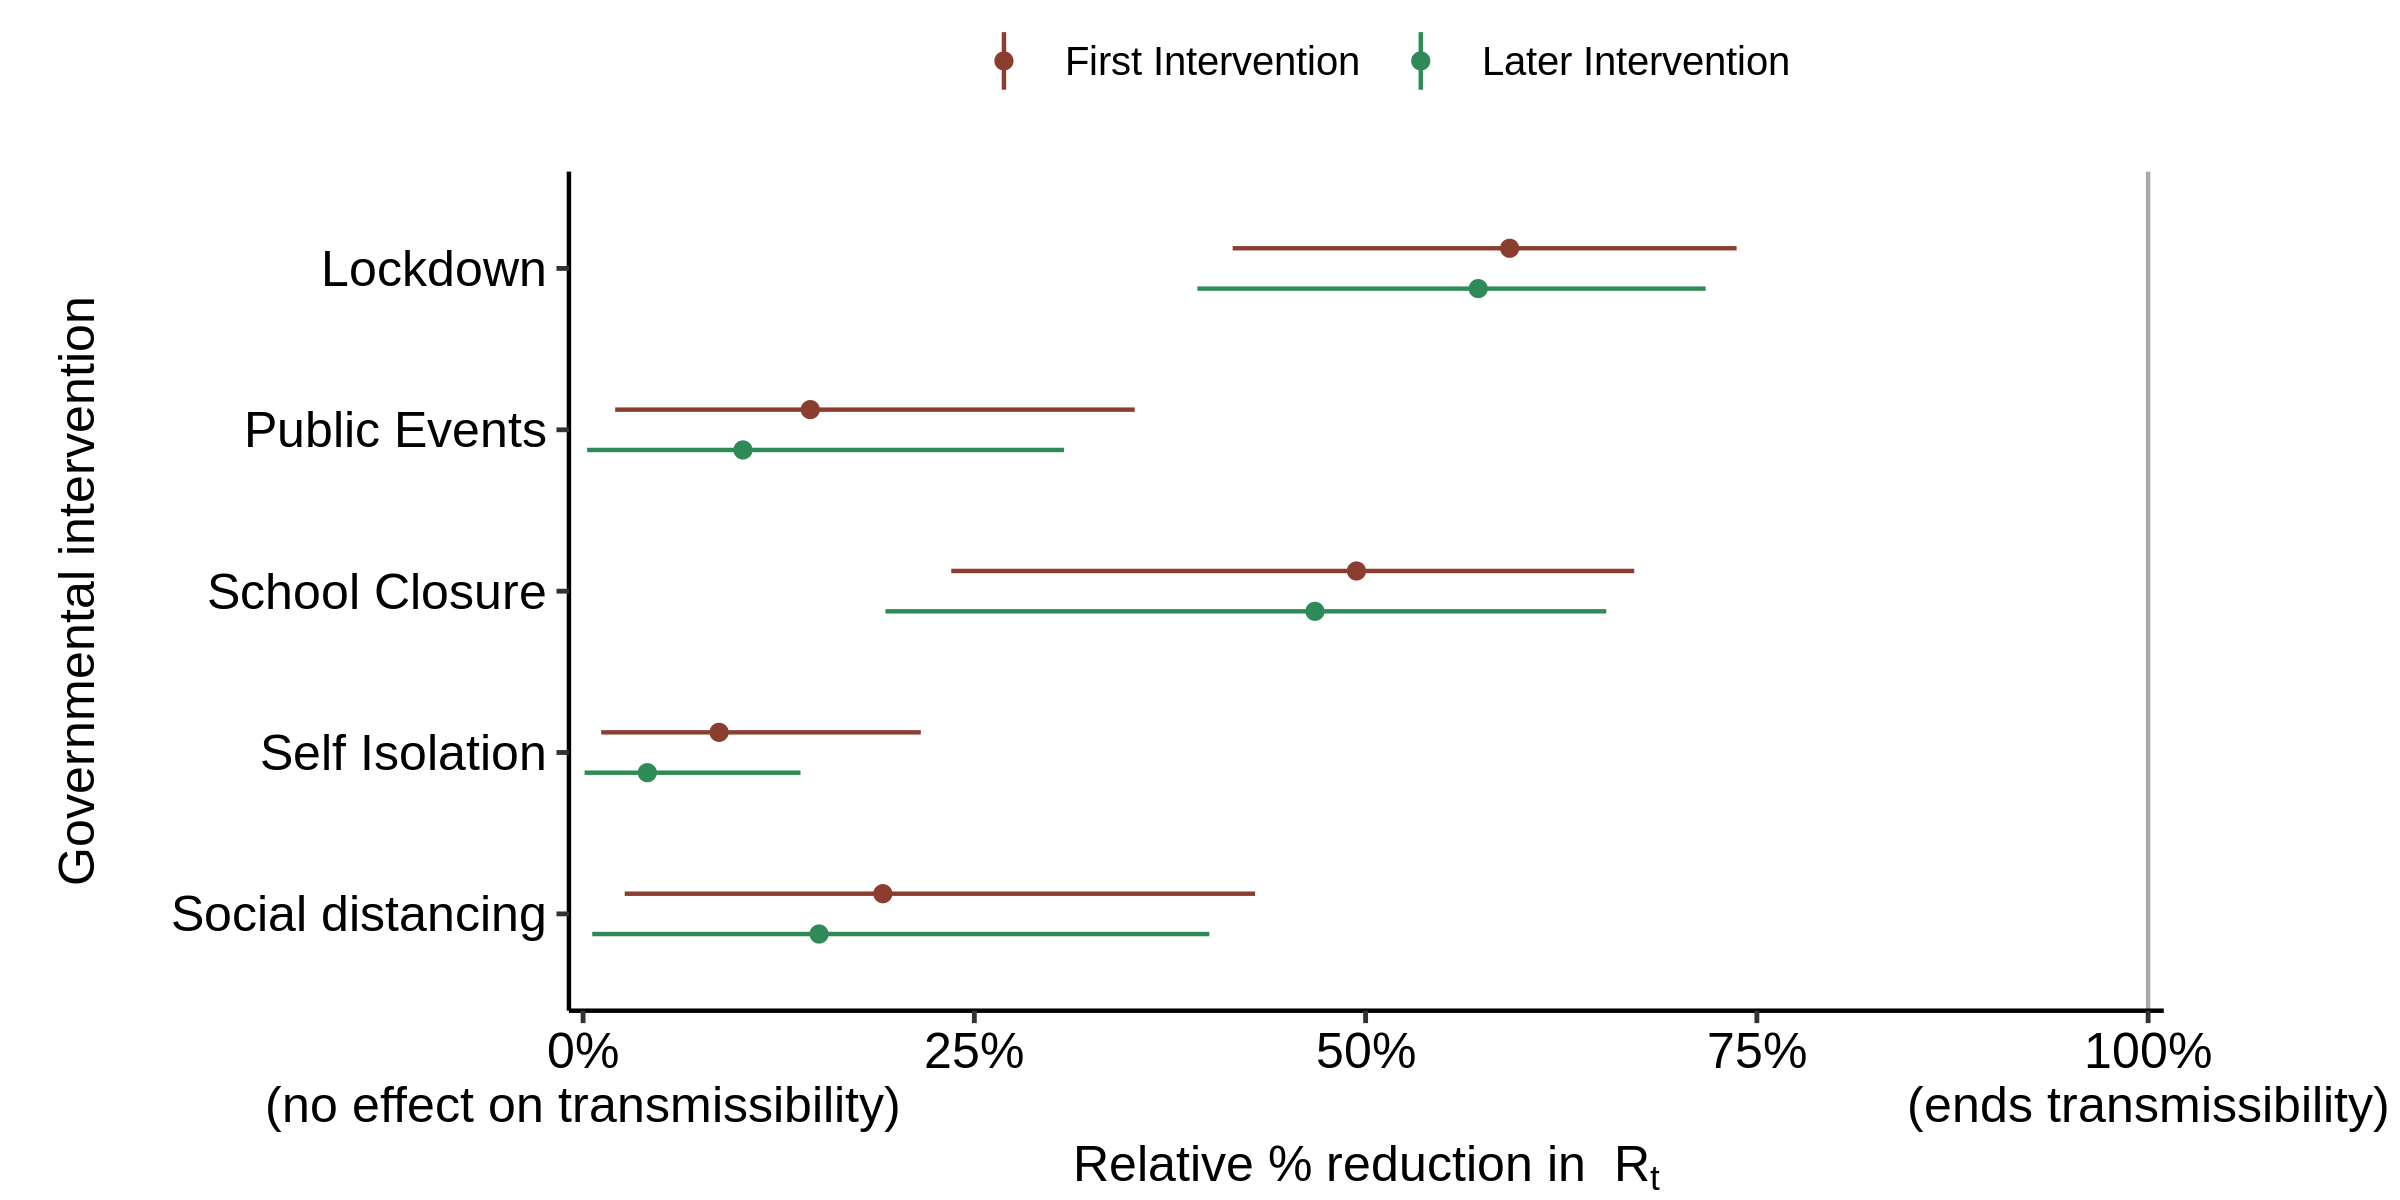
Fig. 6. Effect of interventions on Rt : as in Fig. 5, with the infection to death delay increased by 3 days, but using the flat prior distribution instead of the original prior distribution.
If the infection to death delay is increased by 5 rather than 3 days from Flaxman et al.’s assumed probabilistic magnitude – arguably still as reasonable as Flaxman et al.’s assumption – and the original prior used, the changes in the relative effectiveness of different interventions become even more marked (Figure 7). Lockdown is now estimated to have far less effect than school closure, while social distancing now has a significant effect. The country-specific factor for Sweden becomes small.
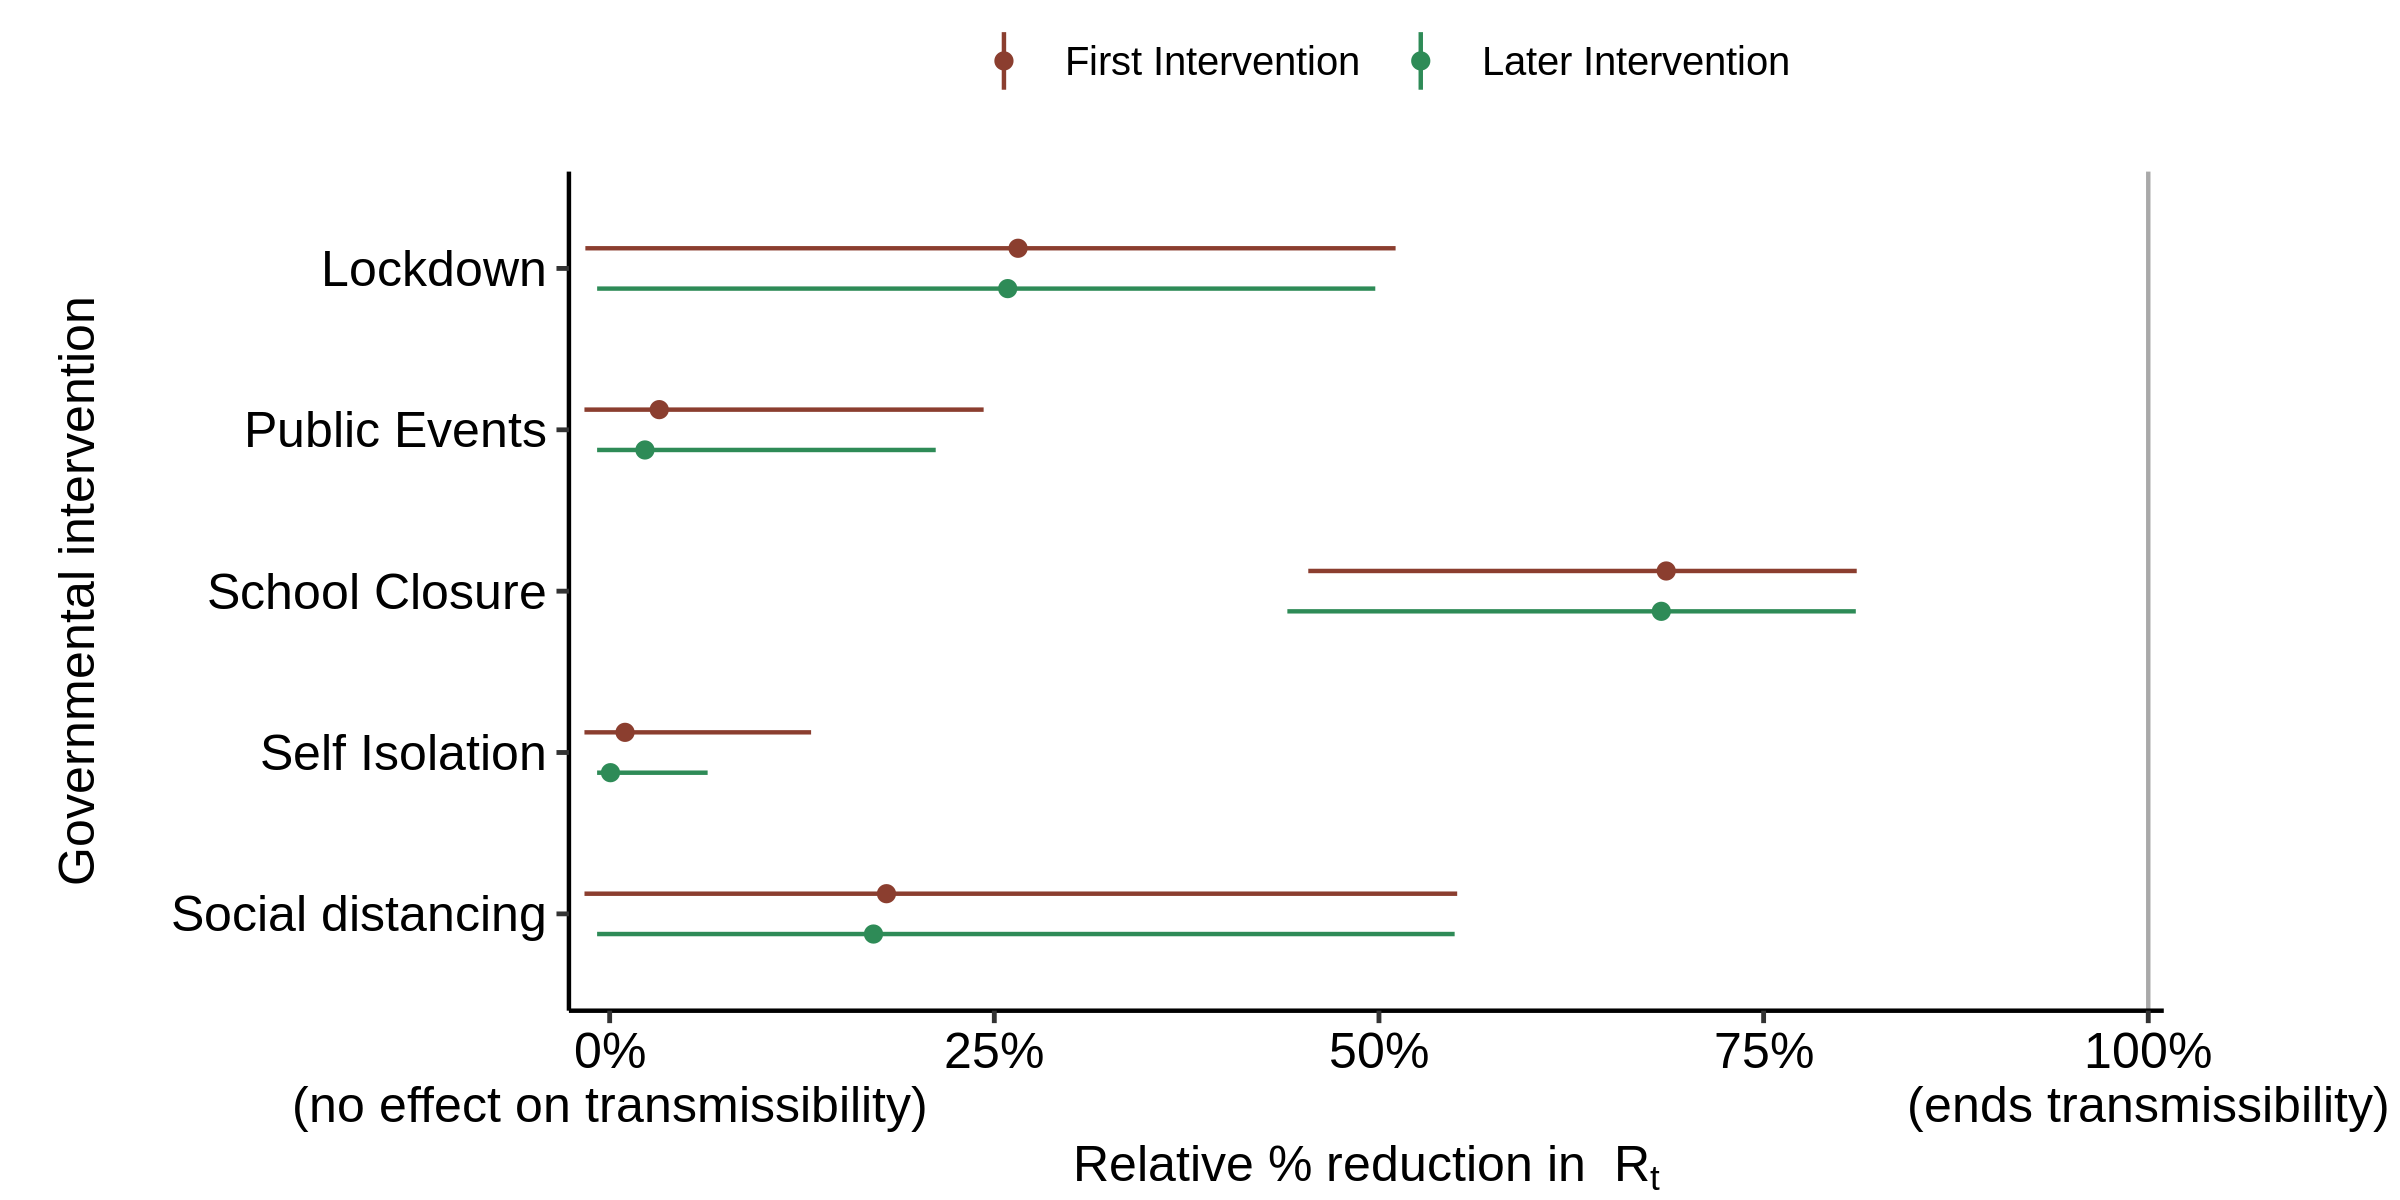
Fig. 7. Effect of interventions on Rt : as in Fig. 5 (original prior) but with the infection to death delay increased by 5 days not 3 days.
When the flat prior is used instead, the estimated effect of school closure reduces while that of all other interventions increases (Figure 8).
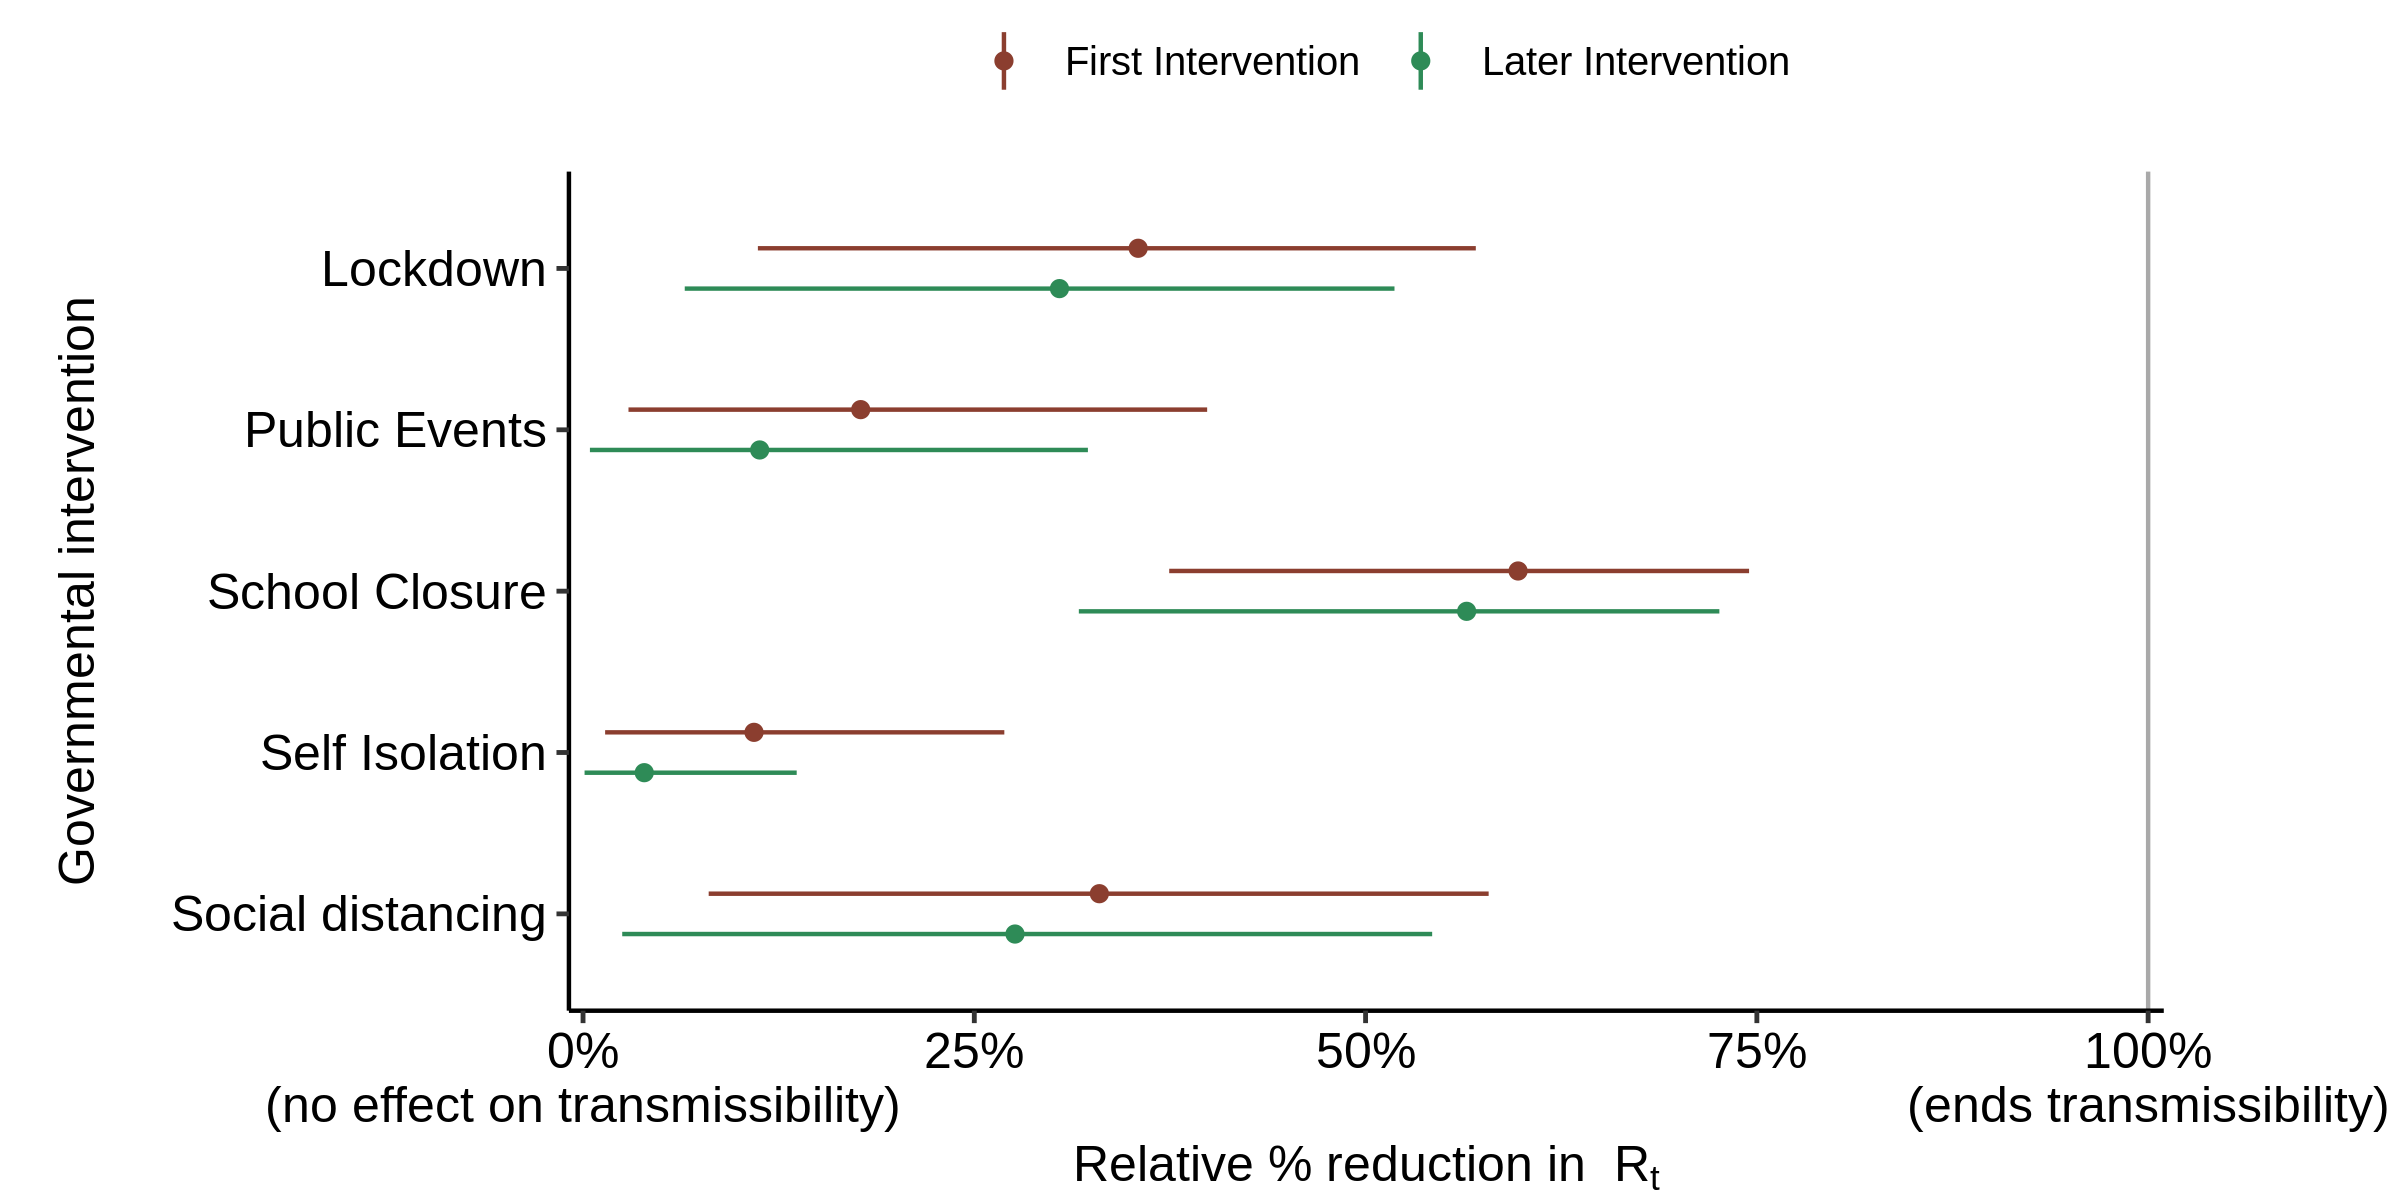
Fig. 8. Effect of interventions on Rt : as in Fig. 6 (flat prior) but with the infection to death delay increased by 5 days not 3 days.
Finally, I investigated the effects of phasing in certain of the interventions. Flaxman et al.’s assumption that all interventions immediately have their full effect on their date of implementation is questionable. It may not be too unrealistic for closing schools, banning public events and decreeing a lockdown, all of which it is feasible to enforce. However, responses to self isolation advice and social distancing encouragement (which both generally preceded a lockdown) are more within the discretion of the individuals concerned, and very arguably would take a little time to reach their final strength.
I examined phasing in over four days the effects of just those two NPIs, with their strength increasing evenly from 25% on the date of implementation to 100% three days later. The result, using the original prior distribution for alpha and making a ~3 day increase in the delay from symptoms to death, is shown in Figure 9. The strength of the reduction in transmission attributed to lockdown reduces slightly compared with the no phase-in case, while than attributed to social distancing increases.
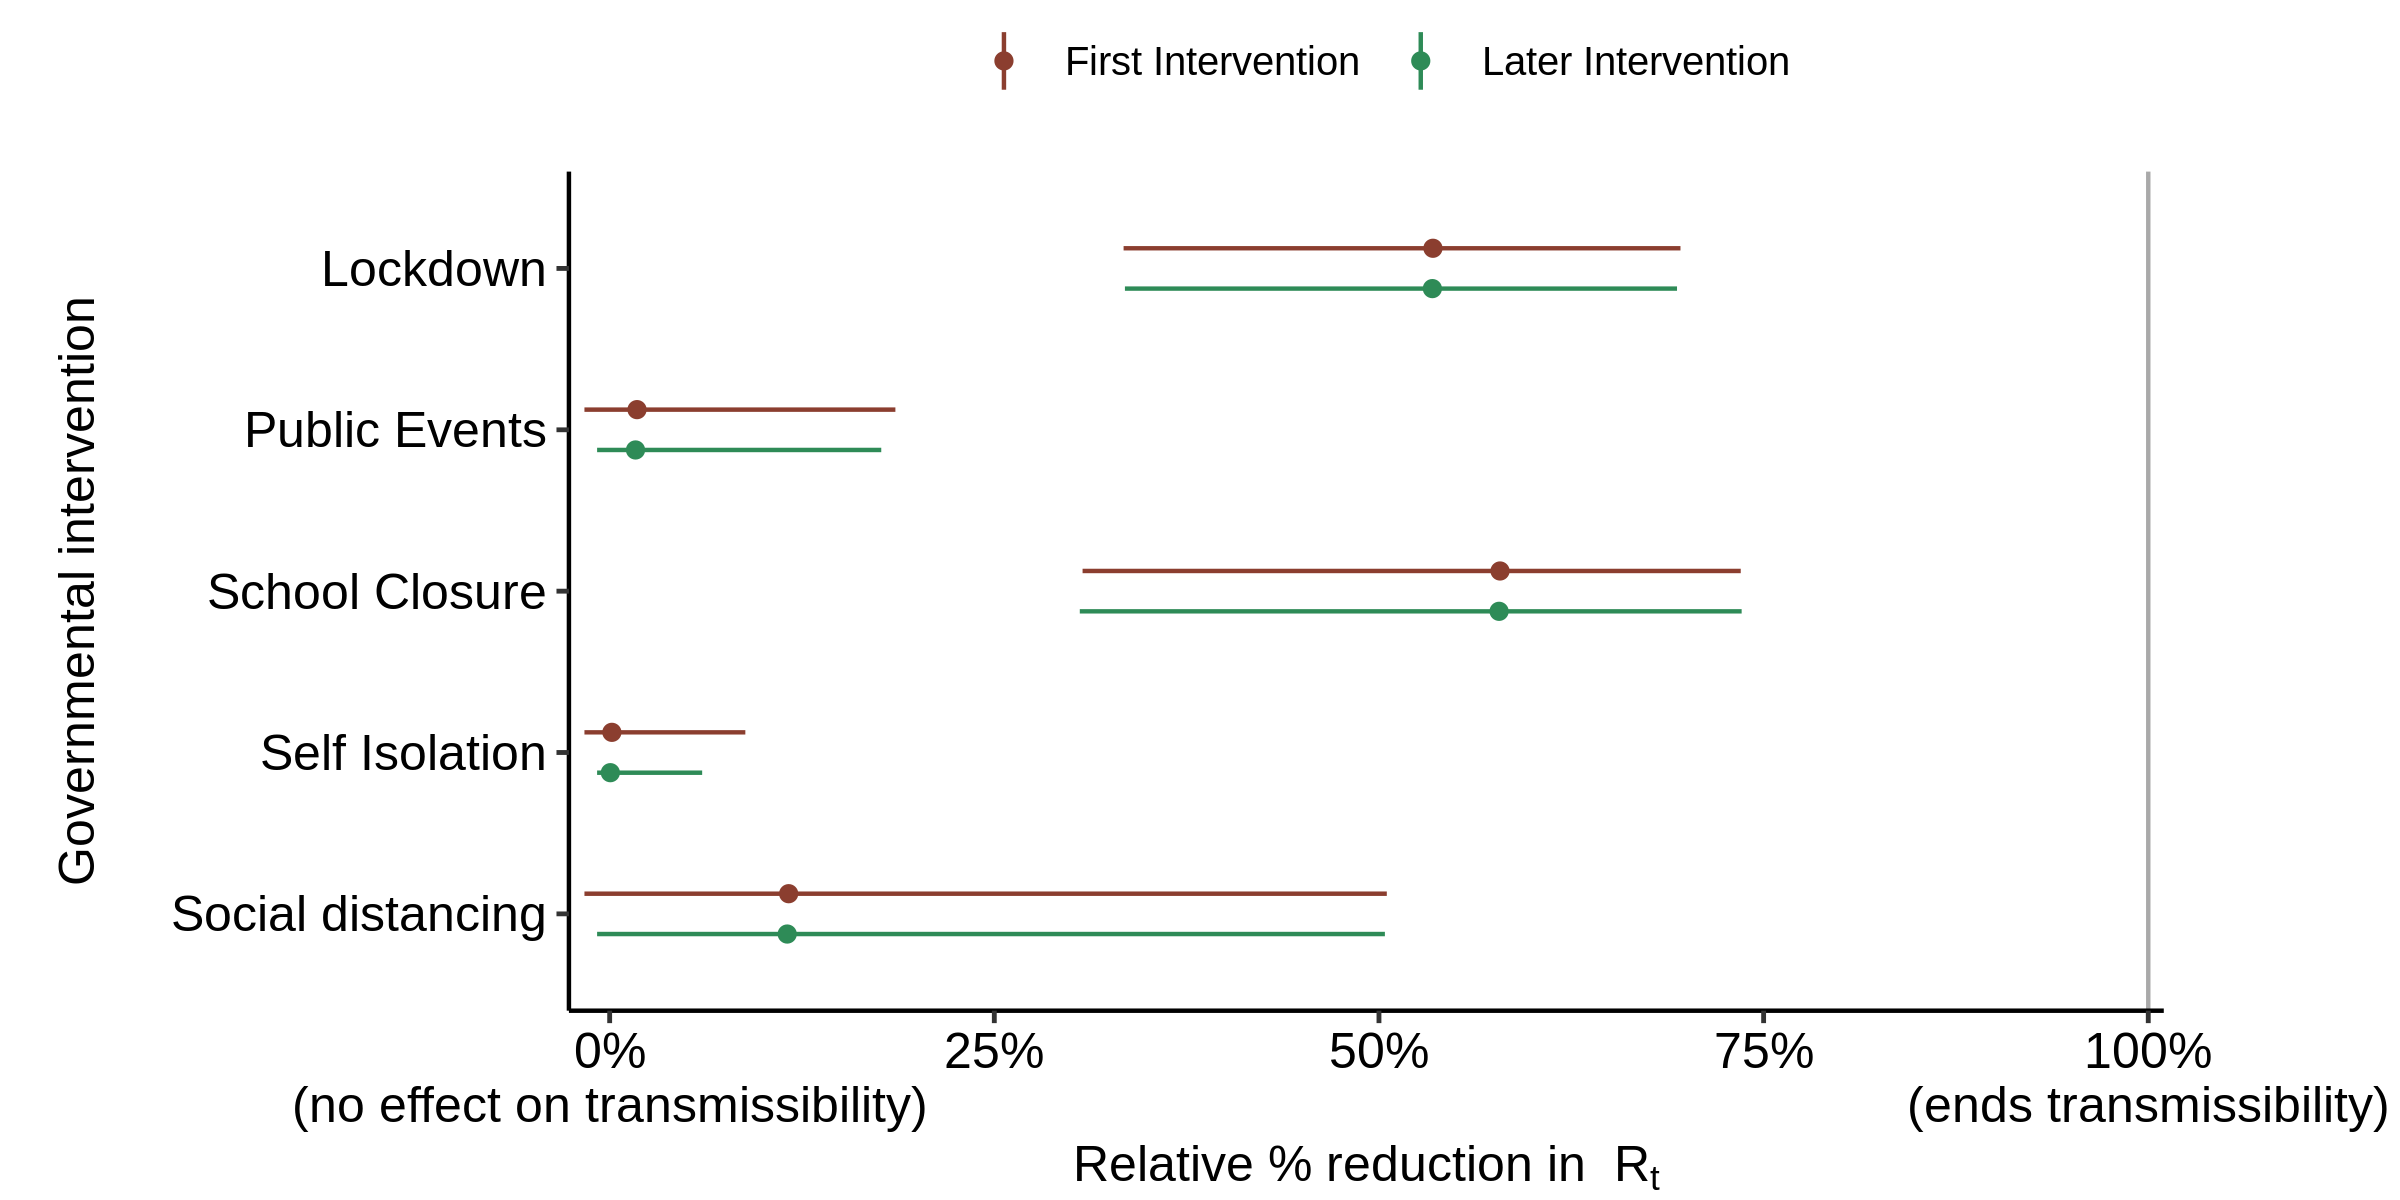
Fig. 9. Effect of interventions on Rt : as in Fig. 5 (original prior), but with the effects of self isolation and social distancing phased in over 4 days and the infection to death delay increased by 3.2 days.
Finally, I repeated this experiment using the flat prior (Figure 10). The strength of the reduction in transmission attributed to lockdown reduces noticeably compared with the no phase-in case, although it is still larger than that of school closure (the estimated effect of which reduces only marginally), while the estimated effects of banning public events and (particularly) social distancing increase markedly.
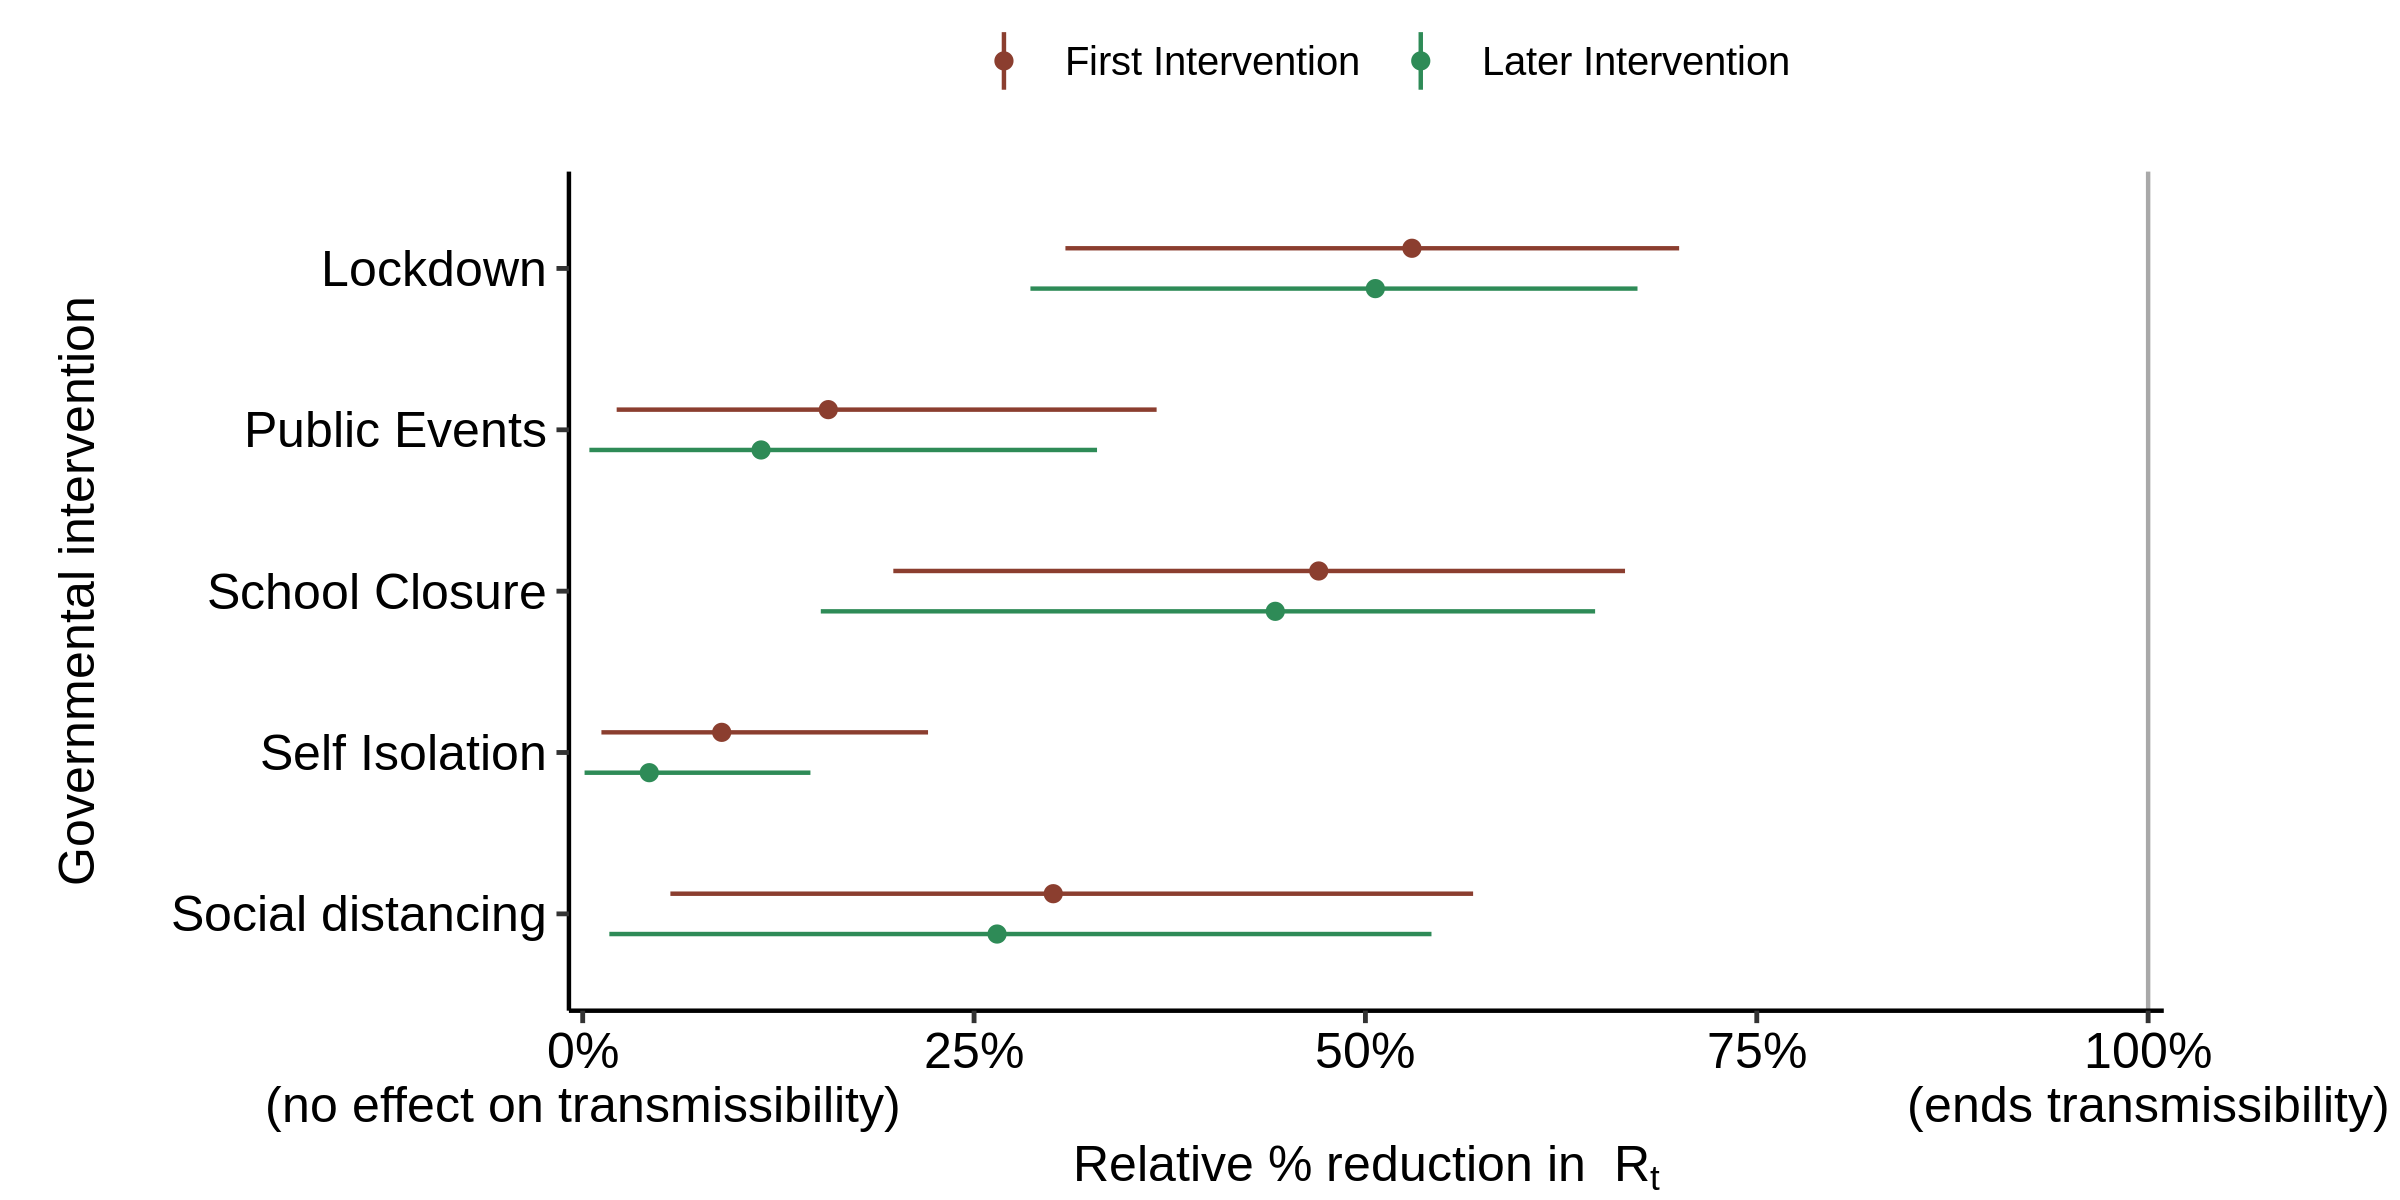
Fig.10. Effect of interventions on Rt : as in Fig. 6 (flat prior), but with the effects of self isolation and social distancing phased in over 4 days and the infection to death delay increased by 3.2 days.
Conclusions
First and foremost, the failure of Flaxman et al.’s model to consider other possible causes apart from NPI of the large reductions in COVID-19 transmission that have occurred makes it conclusions as to the overall effect of NPI unscientific and unsupportable. That is because the model is bound to find that NPI together account for the entire reduction in transmission that has evidently occurred.
Secondly, their finding that almost all the large reductions in transmission that the model infers occurred were due to lockdowns, with other interventions having almost no effect, has been shown to be unsupportable, for two reasons:
- the prior distribution that they used for the strength of NPI effects is hugely biased towards finding that most interventions had essentially zero effect on transmission, with almost the entire reduction being caused by just one or two NPI.
- the relative strength of different interventions inferred by the model is extremely sensitive to the assumptions made regarding the average delay from infection to death, and to a lesser extent to whether self isolation and social distancing are taken to exert their full strength immediately upon implementation or are phased in over a few days.
It seems likely that the inferred relative strengths of the various NPIs are also highly sensitive to other assumptions made by Flaxman et al., and to structural features of their model. For instance, their assumption that the effect of different interventions on transmission is multiplicative rather than additive will have affected the estimated relative strengths of different types of NPI, maybe substantially so. The basic problem is that simply knowing the dates of implementation of the various NPI in each country does not provide sufficient information to enable robust estimation of their relative effects on transmission, given the many sources of uncertainty and the differences in multiple regards between the various countries.
Nicholas Lewis 20 June 2020
[1] Flaxman, S., Mishra, S., Gandy, A. et al. Estimating the effects of non-pharmaceutical interventions on COVID-19 in Europe. Nature (2020). https://doi.org/10.1038/s41586-020-2405-7
[2] Denmark, Italy, Germany, Spain, United Kingdom, France, Norway, Belgium, Austria, Sweden and Switzerland.
[3] The seeding continues for 6 days, with the average number of seed infections per day being inferred by the model.
[4] The numbering of interventions used in their code is 1. school (and/or university) closure ordered; 2. case-based self isolation mandated; 3. public events banned; 4. first intervention; 5. lockdown ordered; and 6. social distancing encouraged.
[5] In mathematical notation, exp[-(alpha[1] + alpha[2] + alpha[3] + alpha[4] + alpha[5] + alpha[6])] is written e–Σα.
[6] The alpha distributions are defined by αi ~ Gamma( shape=1/6, scale=1) − loge(1.05)/6. Hence alpha can range between −loge(1.05)/6 (approximately −0.008) and plus infinity.
[7] “Normal+” means a normal distribution with the negative part of the distribution excluded.
[8] Verity R, Okell LC, Dorigatti I, et al. Estimates of the severity of COVID-19 disease. medRxiv 13 March 2020; https://www.medrxiv.org/content/10.1101/2020.03.09.20033357v1.
[9] The original Flaxman et al. manuscript was submitted on 30 March 2020, the same date as Imperial College published “Report 13: Estimating the number of infections and the impact of non-pharmaceutical interventions on COVID-19 in 11 European countries.”, by the same (or almost the same) authors: https://spiral.imperial.ac.uk/bitstream/10044/1/77731/9/2020-03-30-COVID19-Report-13.pdf . From the referencing of comments in the Nature peer review file, it appears that the original Flaxman et al. manuscript was almost identical to Report 13.
Two months ago in relation to lockdown restrictions you wrote: ‘A more intelligent approach is needed. Fortunately, there is an obvious solution. The key is to remove restrictions from those segments of the population that are at low risk of death from COVID-19 infection.’
Although lockdown is being eased, many of the restrictions (eg on gatherings) remain, and many businesses await a date to re-open. Even when those restrictions are finally removed, it seems likely that guidance on distancing will remain in place which will affect the viability of many businesses and the way people interact. Despite the articles you – and others – have produced, there is still widespread fear over the consequences of easing the measures. So it seems the ‘more intelligent approach’ that you referred to previously is still required. On suggestion for this approach can be found at https://greenbandredband.com. A system which allows individuals to do their own analysis and act accordingly.
Thanks for your comment and the link. The ‘greenbandredband’ approach is clever and looks a promising idea. However, it will need widespread publicity if it is to succeed. Also, I fear that many cautious people (‘redbanders’) may oppose a solution like this that prevents them imposing their own cautious views on other, less cautious, people.
Publicity is indeed the challenge. Or it needs someone in government/SAGE to champion it. When I first touted the system, when lockdown was at its peak, there was far more support from greenbanders who presumably resented the level of restrictions which they perceived to be an inappropriate government response to the available data. However, over the subsequent weeks this has shifted so that the majority of interest is now coming from redbanders. Presumably this reflects a feeling that lockdown is being eased come what may, and that the pace of relaxation of restrictions is greater than many redbanders would like. There is still much talk of distancing restrictions lasting through into next year so it seems there might be a use for the system for some time.
Good write up. I was also pretty shocked by the method used in this paper. One thing though, I think you may have missed the biggest flaw in their method. They seem to have used day of report of death, rather than day of death data. Reporting delays in UK average around 7 days. That is likely to be the main reason that they end up attributing nearly all the effect to the last intervention in nearly every case (because their death data is offset by 7 days vs reality)
Josh
many thanks for your comment. That is a very good point, which I didn’t focus on. By chance, exactly the same point struck me last night, before I read your comment this morning.
Can you point me to a url where I can see the reporting delays for the whole of the UK? Daily deaths for England only are given at https://www.england.nhs.uk/statistics/statistical-work-areas/covid-19-daily-deaths/, where it mentions delays in deaths being attributed to COVID-19 (rather, as I read it, than in the death itself being reported), but without quantification. However, it seems to imply that the deaths are, once they have been attributed to COVID-19, included in the updated total for the actual date of death. I haven’t found a page that gives aggregated daily COVID-19 death data for the whole of the UK; the NHS is run separately in Scotland, England, Wales and N Ireland.
So Flaxman, who only ran his model up to 3 May, could have used updated final death figures for England throughout if he had taken data from the above url. The situation for Sweden is similar, I think. But 3rd party data sources such as Worldometer may well not correctly reflect such updatings, of course.
Flaxman et al. say that they got their data from https://www.ecdc.europa.eu/en/publications-data/download-todays-data-geographic-distribution-covid-19-cases-worldwide. Their total deaths (to 5 May 20) for Sweden in their nature/data/COVID-19-up-to-date.rds deaths data file that they used agees exactly to that available from the ecdc site. But that does appear to have about a 6 day lag relative to the final deaths figures reported by FHM in Sweden.
Do you know of any site where the correct number of daily deaths currently, rather than originally, attributed to COVID-19 are available for all European countries?
Hi,
No, you are quite right, there is no central source of day of death data for Europe. It is hard to get hold of and messy. As you say, even for UK, I haven’t found a perfect source. I use the NHS England data you reference, or the slightly slower ONS data that covers all settings for England and wales (figure 9, here: https://www.ons.gov.uk/peoplepopulationandcommunity/birthsdeathsandmarriages/deaths/bulletins/deathsregisteredweeklyinenglandandwalesprovisional/weekending19june2020 ).
That said, I think this is a situation where (if they must use a method like this), they should have tried to use cleaner data that is available, even if that means using a variety of sources, or built in an appropriate lag. Personally, I feel that in order to understand the impact of lockdown measures on viral reproduction, England only hospital date of death data (same source you linked to) is a really clean source to use. The fact that it is hospital only is probably a feature not a bug for this purpose. There was a significant lag in care home deaths, because the virus took sometime to penetrate and then grew rapidly once it had (with general lockdown policy having no impact on its growth within care homes). In other words care homes deaths, were a separate, tragic phenomenon, the timing of which won’t be easy to connect to lock-down policy interventions.
Also, reporting delays for out of hospital are even longer and more random, so this creates an effect in reported date data, where the lag grew as the proportion of non-hospital deaths grew.
I was being a little too slapdash in asserting there was a 7 day lag between date of death and reported. I just compared the curves again (hospital date of death vs reported), and maybe it’s more like 5 days on average (3 near the start of the epidemic, 7 later on – something like that). Either way, it is significant and messy.
I guess the key point though is that there is some significant lag between the data they have used and the actual date of death. Also, there is some extra lag between community infection and deaths in care homes. They either need to account for these effects, or preferably search for “cleaner” data sources, like the NHS date of death or the ONS reports. Otherwise, with the method they used, they are bound to pin all the effect onto the last intervention, because that’s the model’s last chance to bring down R (which in their lagged data will be seeming to come down late on).
Keep up the great work.
Cheers,
Josh
Hi,
I agree with your conclusions. I have been going through looking at individual countries. Some have excellent data (e.g. Sweden), with archived death time series that were published each day available in numerical form. Germany make this information available but only from 8 May on and only in chart form, so it has to be digitised. Some just publish cumulative data with no indication of how the actual and reported death dates are related. All very messy. And the lags in reporting appear to vary substantially.
Dear Nicholas
I’m heading up a potential action against government for ‘lockdown harms.’ (you can see details here: https://cacuk.world/). Your report is very relevant to part of the evidence we are assessing. What would be helpful to know is, when you wrote this critique of Flaxman, did you send a copy of it to any government officials, or do you happen to know that individuals such as Neil Ferguson, Chris Whitty, Matt Hancock and our not-so-beloved bumbling Boris were made aware of it at all?
If you are able to chat further I’d be most grateful, you have my email.
Thanks
Mina
OK, I’ll respond by email.