A pdf copy of this article is available here.
Introduction
I showed in my last article that inhomogeneity within a population in the susceptibility and infectivity of individuals would reduce the herd immunity threshold, in my view probably very substantially, and that evidence from Stockholm County appeared to support that view. In this article I will first provide other evidence pointing to such population inhomogeneity being very considerable. I will then go on to consider how the overshoot of infections beyond the herd immunity threshold could be reduced.
I’ll start with a recap. The basic reproduction ratio of an epidemic, R0, measures how many people, on average, each infected individual infects at the start of the epidemic. If R0 exceeds one, the epidemic will grow, exponentially at first. But, assuming recovered individuals become immune, the pool of susceptible individuals shrinks over time and the current reproduction ratio falls. The proportion of the population that have been infected at the point where the current reproduction ratio falls to one is the ‘herd immunity threshold’ (HIT). Beyond that point the epidemic is under control, and shrinks.
The higher R0 is, the greater the HIT will be. I used an R0 value of 2.4, the baseline value used in the influential Imperial College model (Ferguson20[i]). Standard simple compartmental models of epidemic growth, which assume a homogeneous population, imply that the HIT equals {1 – 1/R0}. For R0=2.4, they imply the HIT is 58%. For R0 value of 3, which is towards the upper end of most estimates, the HIT is 67%. These naïve, unrealistic values probably account for the HIT range of 60–70% for COVID-19 often cited by epidemiologists quoted in the mainstream media.
There is no doubt that inhomogeneity within a population in the susceptibility and infectivity of individuals will reduce the HIT. I cited the Gomes et al.[ii] paper as showing this and I adopted, with some modifications, its susceptible – exposed – infectious – recovered (SEIR) compartmental model (Figure 1). I also adopted its gamma probability distribution for population inhomogeneity that arose from varying social connectivity – different rates of mixing with (being in contact with) other people, which affects both susceptibility and infectivity. The gamma distribution can represent the existence of a small number of highly connected “superspreaders” with a very high susceptibility and infectivity, together with a far larger number of people who have a much lower connectivity. I used illustrative coefficients of variation (CV) – a measure of the extent of inhomogenity – of 1 and 2 in my article for inhomogeneity related to social connectivity. Those levels are consistent with the evidence.[iii]
![]()
Figure 1. SEIR 4-compartment epidemiological model diagram. Initially all individuals are susceptible. A tiny number are seeded with infection at the start of the epidemic. Exposed individuals are susceptibles who have been infected, but who remain uninfectious until a probabilistic latent period has expired. Once they become infectious they remain so for a probabilistic infectious period and then become ‘recovered’ – which includes some who are still ill and may die, and some who have died while infectious. In the standard model version, the rate of new infections is proportional to the product of the numbers of infectious and susceptible individuals. In the modifed model, these numbers are weighted by respectively the infectivity and susceptibility of each of the individuals involved, both of which vary between individuals according to their social connectivity. Individual infectivity and susceptibility also vary separately, with factors specific to each.
Other evidence regarding the effects of population inhomogeneity
Another recent paper, Britton et al.[iv], also shows that varying social connectivity will lower the HIT for COVID-19. They use, for illustrative purposes, a much simpler probability distribution, with the population divided into only three segments, with arbitrarily chosen social mixing levels, giving rise to a smaller CV of 0.56, and assume R0=2.5 The result is a reduction of the HIT from 60% to 46%. They point out that it is only the disease-induced HIT that is reduced; the HIT for vaccination is unaffected by population inhomogeneity.
It is becoming evident that, in addition to individuals’ general resistance to infection varying, around half the population may well have pre-existing partial immunity to COVID-19 due to previous encounters with other coronaviruses.[v] [vi] [vii] Variation in susceptibility related to resistance to COVID-19 infection is therefore an important factor.
A 20th May preprint paper, McGeoch and McGeoch,[viii] which divides the population into only two parts, considers variability in susceptibility that is related only to resistance to infection, and not to social connectivity. In my model, such variability was included in the probabilistic factor that reflected non-social connectivity related variability in susceptibility. I used probability distributions with CV values of 0.42 and 0.95[ix] to represent that factor, while the CV of their susceptibility distribution is 0.6.[x] They find a significant reduction in the projected HIT and final infected proportion, but a smaller one than in my model. That is to be expected, because their model omits the social connectivity factor, which affects both the susceptibility and infectivity of each individual.
A recent working paper[xi] from the US National Bureau of Economic Research reviews models for the spread of COVID-19, both simple and complex, and their policy implications. It has a whole section on heterogeneities that are not included in standard simple compartmental models, limiting their realism. However, it is not very complimentary about more complex models. Regarding the highly influential, complex Ferguson20 model, it says regarding how it treats the effects of policy intervention:
“The changes in contact rates assumed in this model are never justified and, in fact, appear to be entirely arbitrary and in some cases clearly inaccurate”
They are also strongly critical of the simplistic and very limited treatment of uncertainty in Ferguson20.
As I stated in my original article, the Ferguson20 model appears to account for inhomogeneity in susceptibility arising only from a very limited set of factors, with only a modest resulting impact on the growth of the epidemic. Although their model does account for substantial inhomogeneity in infectivity, using the same gamma distribution as I did, in their case inhomogeneity in infectivity appears to be uncorrelated with inhomogeneity in susceptibility, and thus has a negligible effect on the HIT.[xii]
Reducing the overshoot beyond the herd immunity threshold
Although inhomogeneity can greatly lower the herd immunity threshold, the ultimate proportion of the population that becomes infected will exceed the HIT, since further infections occur after the HIT is reached. Although such infections are continuously diminishing, if the epidemic is unimpeded they have a major impact on its ultimate size. In the examples I gave, I used a R0 value of 2.4. On that basis, I showed that the final infected proportion is about 1.5 times the HIT if the population is homogeneous, and about twice the (far lower) HIT if the population is inhomogeneous in the way that I modelled. Figure 2 shows the moderate inhomogeneity case that I illustrated, for which the HIT is 24% (against 58% for a homogeneous population) but the final infected proportion is 43% (down from 88%), a lesser reduction. The reason for the large overshoot of the HIT is that there are still many infectious individuals at the time the HIT is reached.
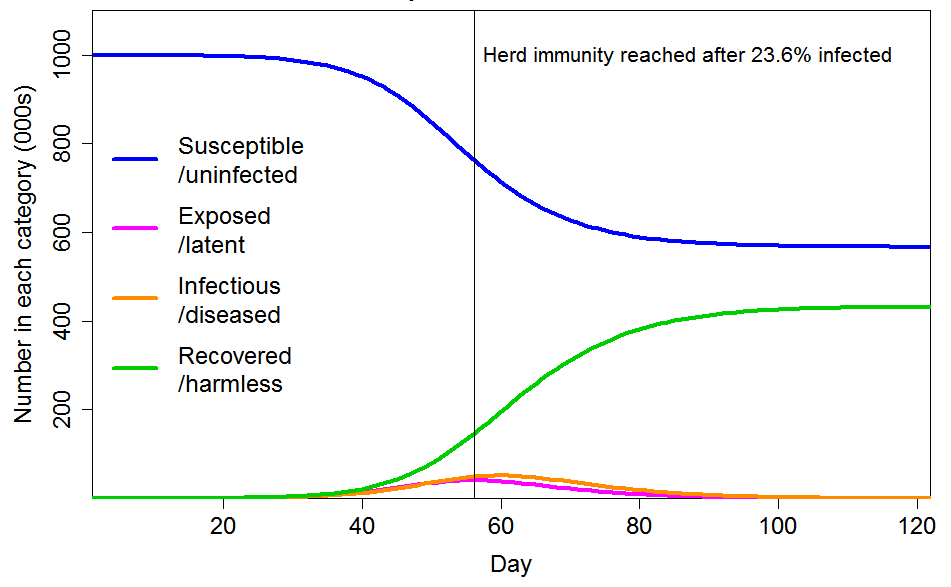
Figure 2. Epidemic progression in an SEIR model with R0=2.4 and a population of 1 million with CV=1 common factor inhomogeneity in susceptibility and infectivity and also unrelated multiplicative inhomogeneity in susceptibility with a CV of 0.42. The latent and infectious periods are 3 and 4 days respectively.
Intervention early on
Government intervention at an early stage appears to have been designed mainly to avoid health systems being overwhelmed, but the subsequent paths of the epidemics show that in most cases it was unnecessarily strong for that purpose. Moreover, as Figure 3 shows in the homogeneous population case, imposing a lockdown early in the epidemic, with the effect of reducing R0 from 2.4 to 0.8, and maintaining it for six months, merely delays the progress of the epidemic, with the final infected proportion barely reducing, from 88% to 86%.
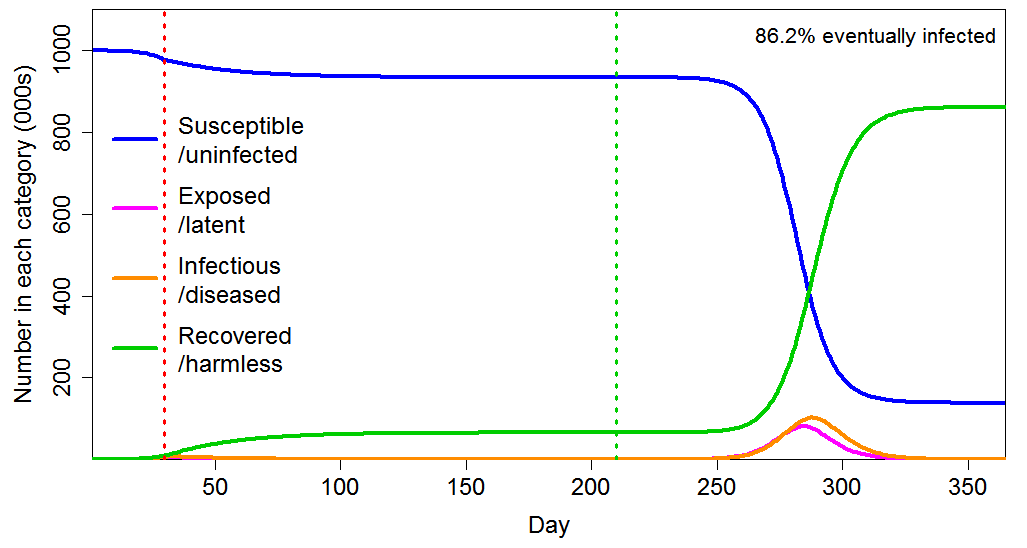
Figure 3 Epidemic progression in an SEIR model with a homogeneous population, where R0=2.4 until a lockdown is imposed (dotted red line) at day 30 after which R0=0.8 until lockdown is ended 180 days later (dotted green line). The latent and infectious periods are as in Figure 2.
The effect of an early imposed, long lockdown is also minor in the heterogeneous population case (Figure 4). The ultimate proportion infected falls by slightly under 5%, from 43% to 41% – still far above the HIT level.
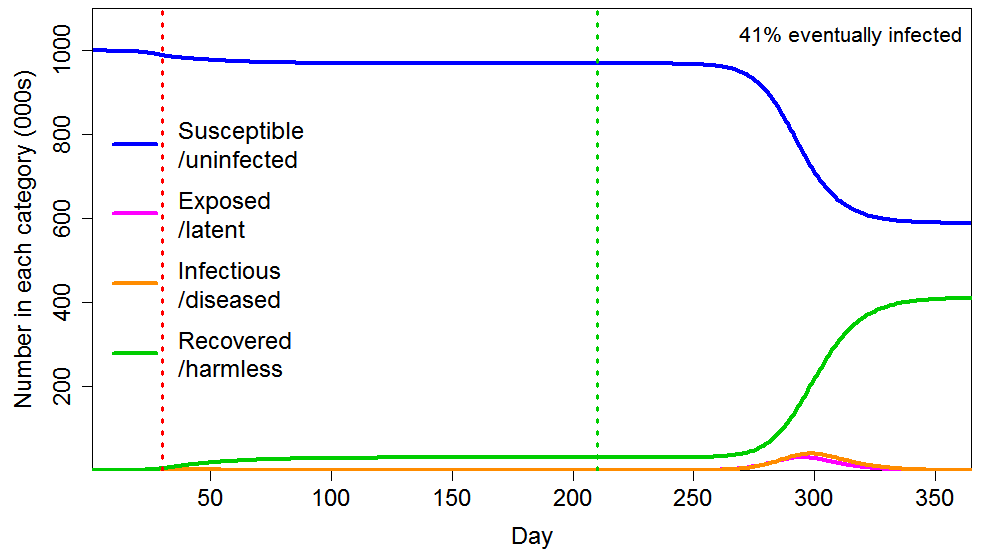
Figure 4 Epidemic progression in an SEIR model with an inhomogeneous population, where R0=2.4 until a lockdown is imposed (dotted red line) at day 30 after which R0=0.8 until lockdown is ended 180 days later (dotted green line). The latent and infectious periods and inhomogeneity are as in Figure 2.
Moreover, intervention can have dangerous longer term effects in relation to infections.[xiii] Absent vaccination becoming available and providing long-lasting immunity, the virus is likely to resurge in the future if herd immunity is not reached in the original epidemic, and vulnerable people may repeatedly be at risk if not totally isolated.
Intervention at a later stage
However, government intervention at a later stage, as the HIT is approached, could enable the overshoot to be greatly reduced. Suppose the intervention, again reducing R0 from 2.4 to 0.8, is instead delayed until the HIT is being approached.
As Figure 5 shows, applying a short lockdown (30 days) later, hugely enhances the reduction in eventual total infections, compared with an early intervention lasting six times as long. The final infected proportion falls from 43% to 27%, rather than only to 41%. The reason is that dramatically slowing the infection as the HIT is approached greatly reduces the number of active infections as the HIT is crossed, and the lockdown also greatly increases the rate at which infections decline thereafter.
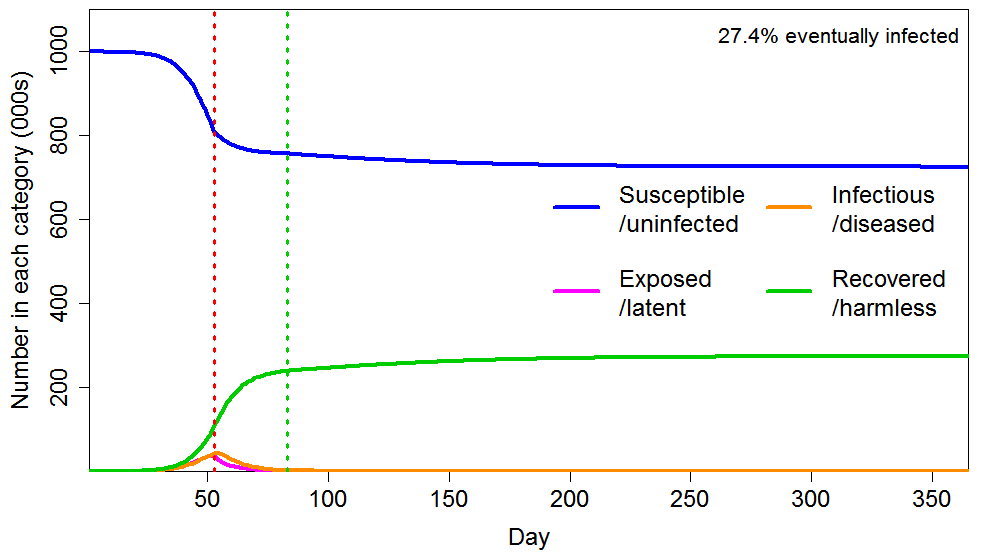
Figure 5 Epidemic progression in an SEIR model with an inhomogeneous population, where R0=2.4 until a lockdown is imposed (dotted red line) at day 53, after which R0=0.8 until lockdown is ended 30 days later (dotted green line). The latent and infectious periods and inhomogeneity are as in Figure 2.
If the population were prepared to obey a lockdown for 60 days at that stage, and its timing were perfect, it would potentially be feasible virtually to eliminate the overshoot of the HIT. Figure 6 shows this case. To three significant figures, the final infected proportion equals the HIT.
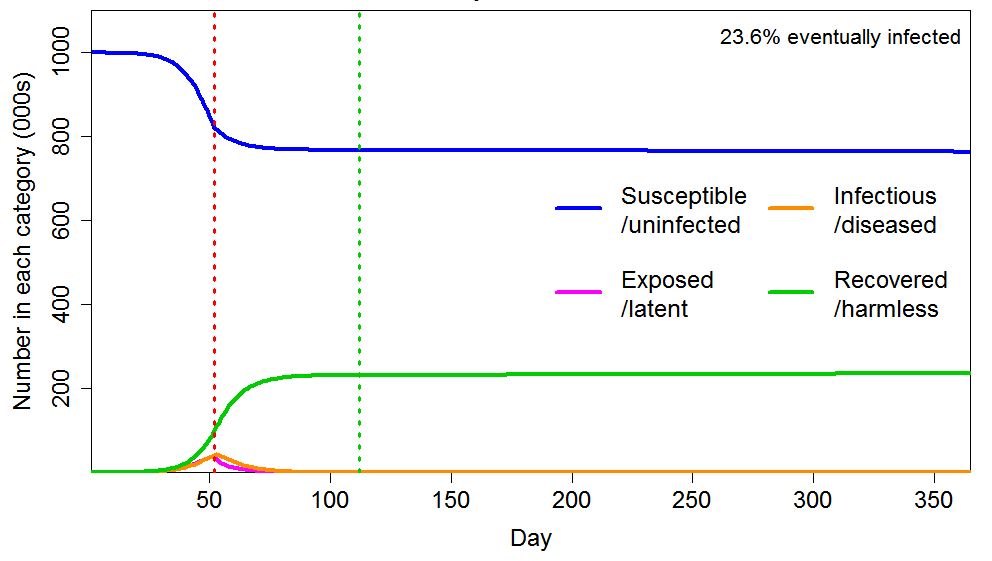
Figure 6 Epidemic progression in an SEIR model with an inhomogeneous population, where R0=2.4 until a lockdown is imposed (dotted red line) at day 52, after which R0=0.8 until lockdown is ended 60 days later (dotted green line). The latent and infectious periods and inhomogeneity are as in Figure 2.
Conclusions
The take home lessons are, first, that imposing stricter restrictions early in an epidemic than are necessary to prevent a health system being overwhelmed is likely to have little impact on the proportion of the population that is eventually infected, in the absence of a vaccine becoming available before restrictions are relaxed. And secondly, that a well-timed imposition of strict restrictions for a fairly short period as the herd immunity threshold is approached can hugely reduce the overshoot of the eventually infected proportion above the HIT. States that imposed strict restrictions early on and then relaxed them may find their populations unwilling to see such measures reintroduced. However, the populations of states that introduced milder restrictions and are in reality pursuing a herd immunity strategy may find the imposition of strict restrictions for a short period bracketing the crossing of the HIT to be an attractive option. In either case, the serious illness and fatalities associated reaching the eventual level of infections can be very greatly reduced if elderly and vulnerable people are shielded from infection, as discussed in an earlier article.[xiv]
Nicholas Lewis 28 May 2020
[i] Neil M Ferguson et al., Impact of non-pharmaceutical interventions (NPIs) to reduce COVID-19 mortality and healthcare demand. Imperial College COVID-19 Response Team Report 9, 16 March 2020, https://spiral.imperial.ac.uk:8443/handle/10044/1/77482
[ii] Gomes, M. G. M., et al. Individual variation in susceptibility or exposure to SARS-CoV-2 lowers the herd immunity threshold. medRxiv 2 May 2020. https://www.medrxiv.org/content/10.1101/2020.04.27.20081893v1
[iii] My lower CV=1 level was also the lower level illustrated by Gomes et al., but I used a more conservative upper level, of CV=2, than their choice of CV=3. That was partly because, unlike Gomes et al., I also had a inhomogeneity of susceptibility factor that was unrelated to social connectivity. However, I cited two COVID-19 studies [iii] [iii] that gave best estimates for the social connectivity CV of marginally above 3. Gomes et al. also provided some arguments in favour of connectivity-related CV being as high as 3, and argued that such CV probably exceeded 1. They showed that for other infectious diseases CV varies between 1.8 and 3.3, and they said, referring to a SARS-CoV study:
“the way authors describe superspreaders is suggestive that higher infectiousness stems from higher connectivity with other individuals, who may be susceptible. This would support the scenarios displayed in Figure 2, with CV = 3 for exposure to infection.”
[iv] Britton, T., Ball, F. and Trapman, P., 2020. The disease-induced herd immunity level for Covid-19 is substantially lower than the classical herd immunity level. arXiv preprint arXiv:2005.03085.
[v] Grifoni, A.et al Targets of T cell responses to SARS-CoV-2 coronavirus in humans with COVID-19 disease and unexposed individuals. Cell doi:10.1016/j.cell.2020.05.015
[vi] Braun, J., Loyal, L., Frentsch, M., Wendisch, D., Georg, P., Kurth, F., Hippenstiel, S., Dingeldey, M., Kruse, B., Fauchere, F. and Baysal, E., 2020. Presence of SARS-CoV-2 reactive T cells in COVID-19 patients and healthy donors. medRxiv preprint https://www.medrxiv.org/content/10.1101/2020.04.17.20061440v1.
[vii] Le Bert, N. et al., 2020. Different pattern of pre-existing SARS-COV-2 specific T cell immunity in SARS-recovered and uninfected individuals. bioRxiv preprint https://doi.org/10.1101/2020.05.26.115832
[viii] Malcolm W McGeoch and Julie McGeoch, 2020. COVID-19 Propagation and Mortality in a Two-Part Population. medRxiv preprint doi:10.1101/2020.05.17.20104356
[ix] These CVs resulted from using zero (log)mean lognormal distributions with log standard deviations of 0.4 and 0.8.
[x] However, with their model having only two population segments with different susceptibility rather than a continuous distribution the CV may not be directly comparable with that in my model.
[xi] Avery, C. et al., 2020: Policy Implications of Models of the Spread of Coronavirus: Perspectives and Opportunities for Economists. NBER Working Paper No. 27007
[xii] A highly susceptible but averagely infectious person is more likely to be removed from the susceptible pool early in an epidemic, reducing the average susceptibility of the pool. However, no such selective removal occurs for a highly infectious person of averagely susceptibility. Therefore, as Gomes et al. point out, variability in susceptibility lowers the HIT, but variability in infectivity does not do so except to the extent that it is correlated with variability in susceptibility.
[xiii] See this interview with Professor Senetra Gupta of Oxford University: https://unherd.com/2020/05/oxford-doubles-down-sunetra-gupta-interview/
[xiv] A sensible COVID-19 exit strategy for the UK, Nicholas Lewis, 26 April 2020
Leave A Comment